ダイナミックボリューム移動平均トレンドフォローとHLCC4ブレイクアウト取引戦略

1
Follow
1781
Followers
概要
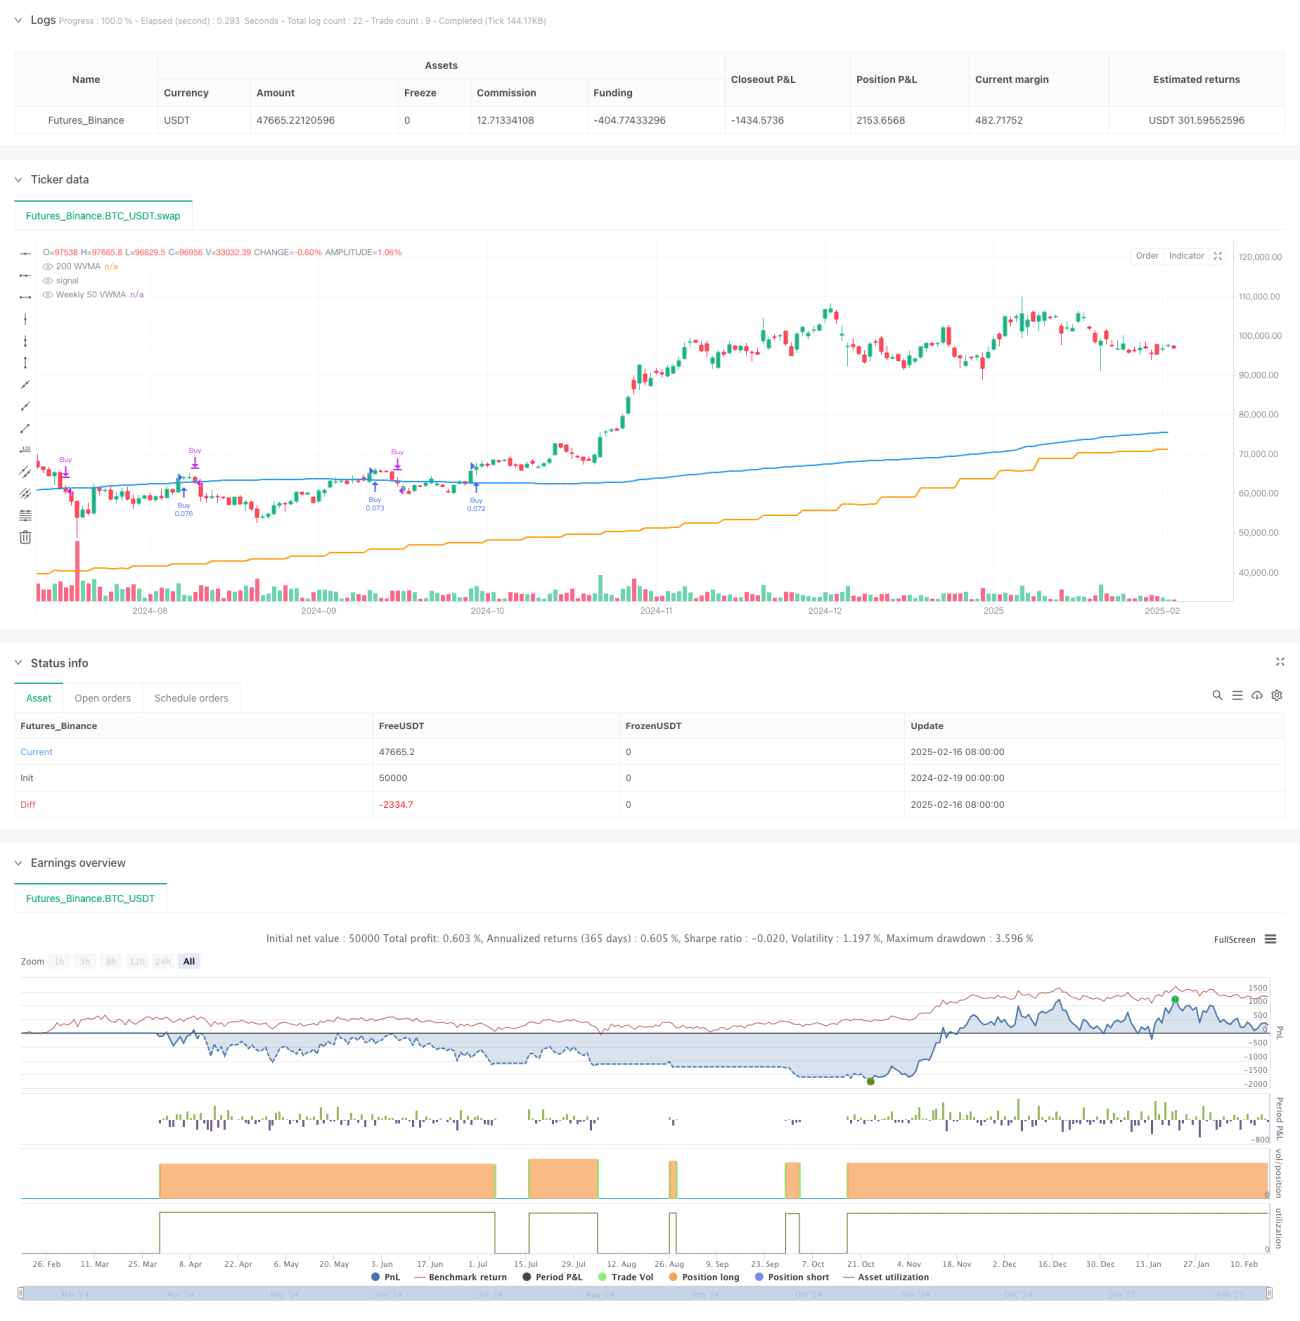
この戦略は,周回50周期の交差量加重移動平均 ((VWMA) を大トレンドフィルターとして組み合わせ,現在のタイムサイクルの200サイクルVWMAとHLCC4の価格突破を具体的な取引信号として使用する,複数のタイムサイクルのトレンド追跡システムである.これは,厳格なトレンド確認と複数のタイムサイクルの検証によって取引の信頼性を向上させるだけの戦略である.
戦略原則
この戦略の核心的な論理は以下の通りです.
- 周回50周期VWMAを大トレンドの判断基準として使用し,価格がこの平均線上にある場合にのみポジションを開くことを許可する.
- 入場条件は,連続した2つのK線の閉盘価格が200周期VWMA上であり,第2のK線の閉盘価格が第1のK線のHLCC4平均値より高いことを満たす必要がある.
- 出場シグナルは日線レベルに基づいて,日線閉盘価格が日線200周期VWMAを下回ると平仓する.
- 戦略は,固定ポジション管理方式を採用し,取引ごとに口座権益の10%を使用する.
- 最近の5年間の週間の期限制を反省し,近年の市場環境で戦略の有効性を確保する.
戦略的優位性
- 複数の時間周期の検証:周線と日線の配合により,大きなトレンドを把握し,市場変化に適時に対応することができます.
- リスク管理の改善:VWMAは,SMPの代わりに,市場の現実的な動きをよりよく反映します.
- トレンド確認の厳格性:複数の条件を同時に満たすことで,偽突破のリスクを低減する.
- ポジション管理は合理的:固定比率のポジション管理方式は,リスクをコントロールし,利益の余地を維持する.
- 高度な自動化: 戦略の論理が明確で,完全に自動化された取引が可能である.
戦略リスク
- トレンド反転のリスク: 市場が激しく波動すると,大きな引き下がりが起こる可能性があります.
- スライドポイントの影響:市場の流動性が不足している場合,実際の取引価格が理論価格から偏っている可能性があります.
- 信号遅延: 平均線がより長い周期を使用しているため,トレンドの転換点での戦略の反応は比較的遅れている可能性があります.
- 偽突破の危険性:複数の確認にもかかわらず,偽突破による損失が発生する可能性があります.
- 一方向取引の制限: 策略は多すぎると,下落傾向で潜在的空調の機会を逃してしまう.
戦略最適化の方向性
- 動的パラメータ最適化:市場の変動率に応じてVWMAの周期パラメータを自動的に調整することができる.
- ポジション管理の最適化:変動率に基づくダイナミックなポジション管理システムを導入.
- 出場メカニズムの改善: 移動ストップまたは技術指標に基づく動的ストップを追加できます.
- 市場情緒の指標を増やす:RSIやMACDなどの指標と組み合わせて,信号の信頼性を高める.
- 取引量分析の導入:取引量分析の深化,VWMAの計算方法の最適化.
要約する
これは,厳格なトレンド追跡戦略を設計し,複数のタイムサイクルと厳格な取引条件を組み合わせることで,より良いリスク制御を実現する戦略である. 戦略の核心的な優点は,その完善なトレンド確認機構と明確な取引ロジックであり,強力な市場で中長期のトレンドの機会を把握するのに適しています. 提案された最適化方向によって,戦略はさらに向上する余地があります.
Source
Pine
/*backtest
start: 2024-02-19 00:00:00
end: 2025-02-17 00:00:00
period: 1d
basePeriod: 1d
exchanges: [{"eid":"Futures_Binance","currency":"BTC_USDT"}]
*/

//@version=6
strategy("Long-Only 200 WVMA + HLCC4 Strategy (Weekly 50 VWMA Filter, Daily Exit, Last 5 Years)", overlay=true, default_qty_type=strategy.percent_of_equity, default_qty_value=10)

// ParametersStrategy parameters
Related strategies
Comment
All comments (0)
No data
- 1