ニューラル移動平均クロスオーバートレンドフォロー戦略とEMAフィルターシステムの組み合わせ

1
Follow
1781
Followers
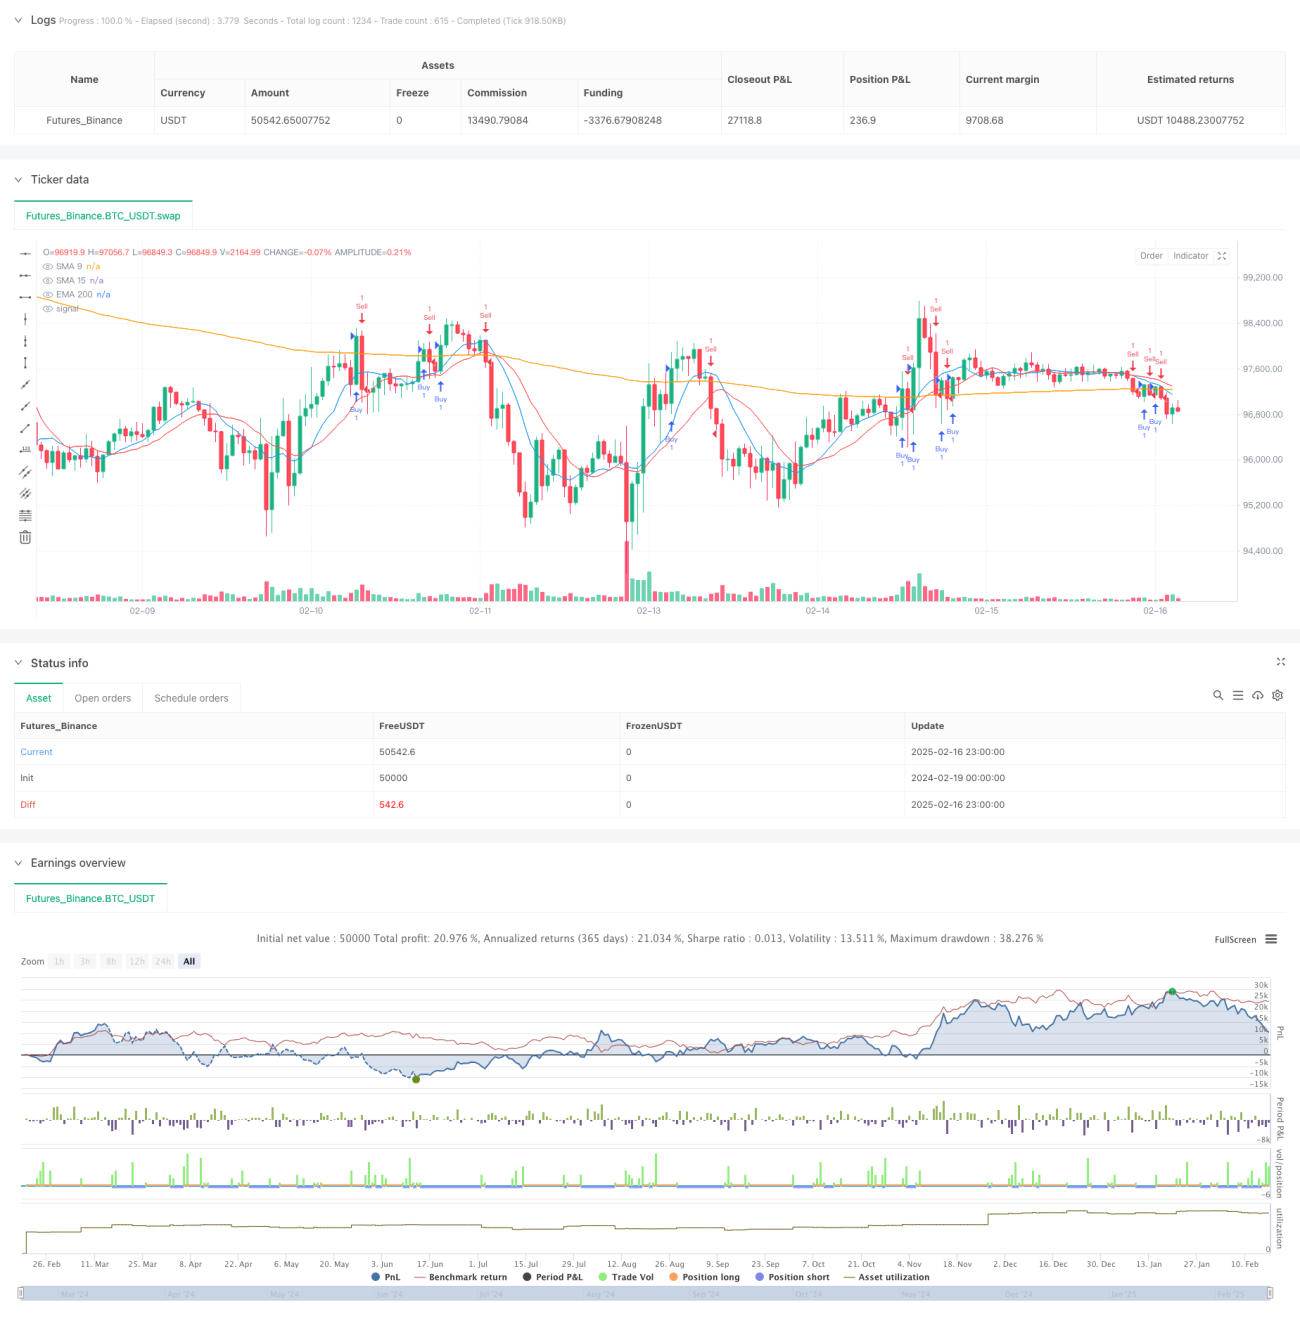
概要
この戦略は,均線交差信号とトレンドフィルターに基づいた取引システムである.短期SMA ((9サイクルと15サイクル) の交差信号と長期EMA ((200サイクル) の交差信号をトレンドフィルターとして組み合わせて,異なる時間周期の均線交差によって市場トレンドを捉える.システムには,トレンドが継続するときに再入場するメカニズムが含まれている.
戦略原則
戦略は,三重均線システムで取引決定を行います.
- 9周期と15周期の単純移動平均 ((SMA)) を使って取引信号を生成する
- 200周期指数移動平均 ((EMA) をトレンドフィルターとして使用
- 短期SMA ((9サイクル) が15サイクルSMAを上向きに通過し,価格が200サイクルEMAを超えると多行シグナルが生成される
- 短期SMA ((9サイクル) が15サイクルSMAを下回り,価格が200サイクルEMAを下回ったとき,空調シグナルが生じる
- このシステムはまた,再入場論理を含み,初期クロスシグナルの後,価格が200EMAの正しい側に維持される限り,倉庫を再建することを許可します.
戦略的優位性
- 複数の時間枠分析:短期と長期の平均線を組み合わせ,より包括的な市場見通しを提供する
- トレンドフィルター:偽信号をフィルターする200EMAを使用して取引の質を向上させる
- 再入場メカニズム:強気なトレンドで複数の入場を許可し,収益性を高める
- 明確な出入場ルール:客観的な技術指標に基づいて主観的な判断を減らす
- 双方向取引:多空の両方向で利益を得ることができる
- リスク管理統合:均線システムによるリスクの自動制御
戦略リスク
- 横盤市場における誤信号の頻度
- 遅滞のリスク:移動平均は本質的に遅滞の指標であり,最良の入場点を逃す可能性があります.
- トレンド逆転リスク: 市場が急激に逆転した場合に大きな損失を被る可能性
- 再入場リスク:過度な倉庫建設は過重ポジションにつながる可能性がある
緩和策:
- 追加市場変動のフィルター
- ポジションの最大限を設定する
- ダイナミック・ストップ・メカニズムを使用
- ポジション管理システムの導入
戦略最適化の方向性
- ダイナミックサイクル最適化:
- 市場波動に合わせて平均線周期を自動的に調整する
- 適応移転平均 ((AMA) を固定周期平均線に代えて導入
- 入場最適化:
- 音量を上げる確認
- 追加動量指標検証
- 価格の形式確認を導入する
- リスク管理の最適化:
- ダイナミックなポジション管理を実現
- 追跡停止を追加する
- 変動率に基づくストップ・ローズ設定
- 論理的な最適化:
- トレンドの強さを確認する
- 設計梯度倉庫システム
- 市場環境の認識に参加する
要約する
この戦略は,複数の均線システムとトレンドフィルターを組み合わせて,完全なトレンド追跡取引システムを構築する.その主な優点は,強いトレンド市場で有意な収益を得ることができ,同時に均線フィルターと再入場メカニズムによってシステムの安定性を高めることです.いくつかの固有のリスクがあるものの,最適化方向の実施によって戦略のパフォーマンスをさらに向上させることができます.この戦略は,中長期の市場傾向を追跡するのに適しており,忍耐強いトレーダーにとって信頼性の高い取引ツールです.
Source
Pine
Related strategies
Comment
All comments (0)
No data
- 1