1
フォロー
1750
フォロワー
概要
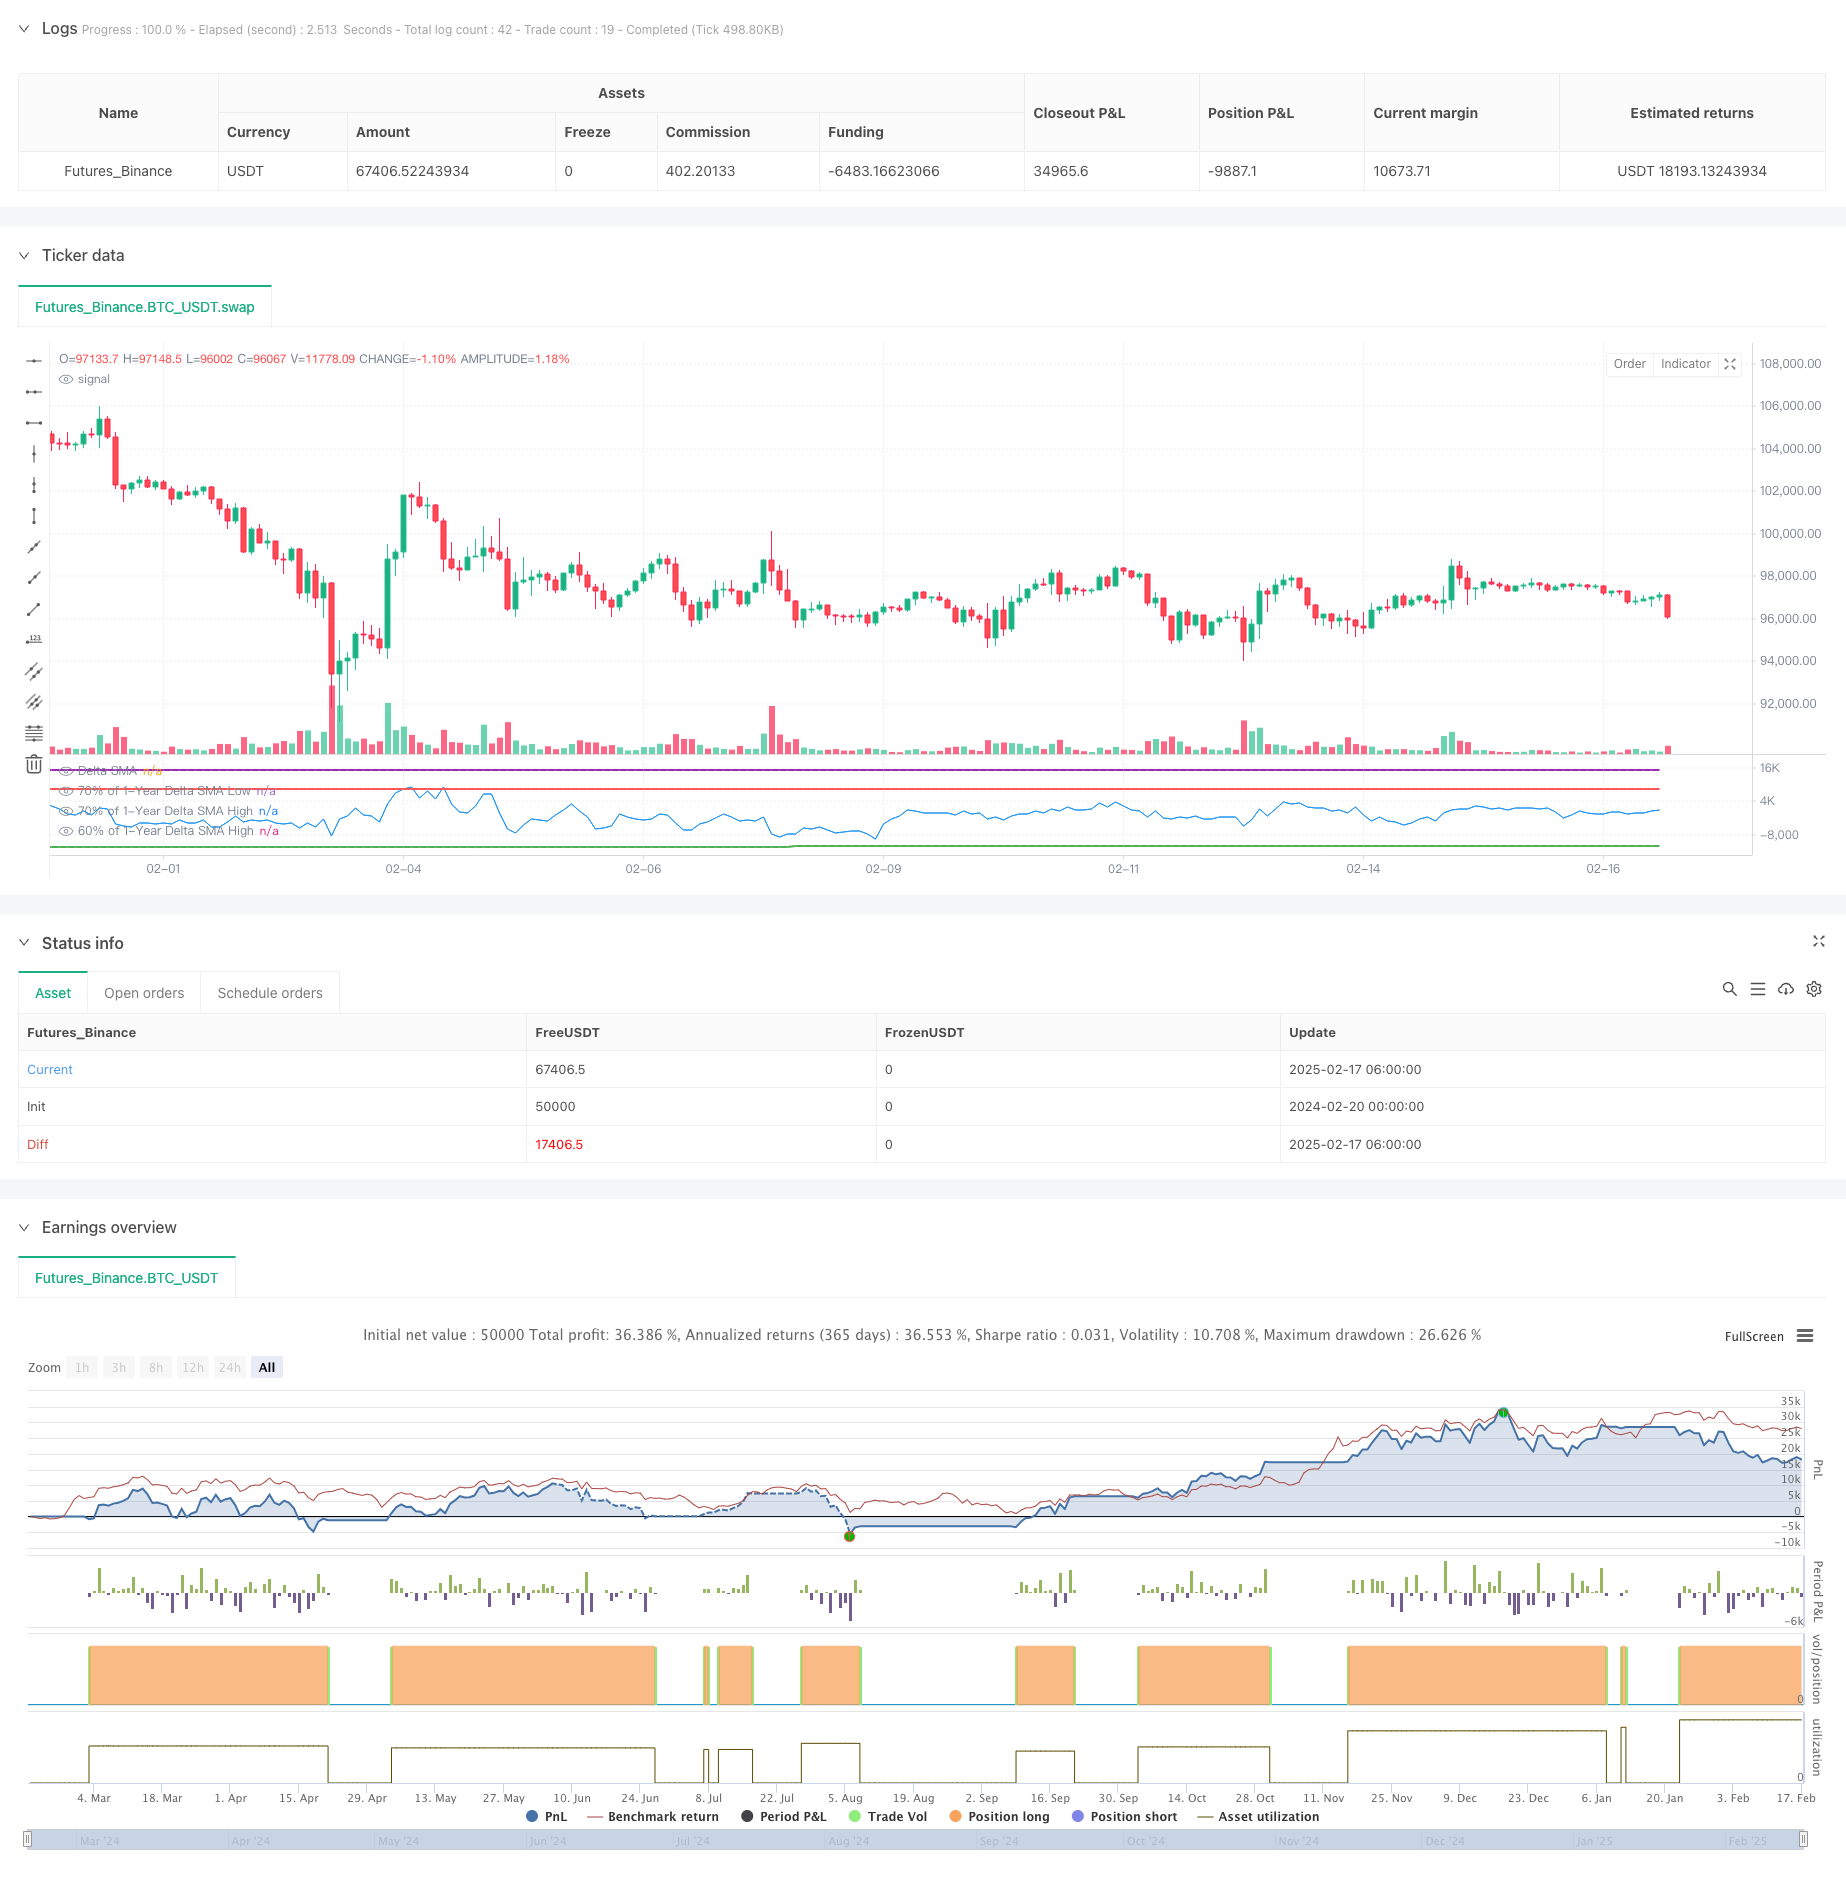
これは,SMA (単純移動平均) による1年間の高低分析による取引戦略である.この戦略は,値差の移動平均を計算し,それを歴史的高低値と比較して潜在的取引信号を識別する.この戦略は,長期の回帰期を採用し,中長期のトレンド取引に適しています.
戦略原則
戦略の中核となるロジックは、次の主要なステップに基づいています。
- デルタ計算:価格動向を分析して買賣量差を計算する.閉盘価格が開盤価格より高いときは買取量として記録され,逆に売り量として記録される.
- SMA平滑処理:デルタ値を14サイクル移動平均処理して,ノイズを減らす.
- 1年間の高低値を決定する:過去1年の最高値と最低値のデルタSMAを計算する.
- シグナル発射条件:
- 買入シグナル: デルタSMAが1年低点70%を下回った後に0を突破するとトリガーされる
- 販売シグナル: デルタSMAが1年高点90%を突破し,60%を下回るとトリガー
戦略的優位性
- 長期トレンド把握能力: 一年間の歴史データ分析により,主要トレンドを効果的に捉えることができる.
- 騒音フィルタリング効果:SMAのスムーズ処理と複数の値条件を使用し,偽信号を効果的に減少させる.
- リスク管理は合理的:入場・出場条件を明確に設定し,過度な取引を避ける.
- 適応性:戦略のパラメータは,異なる市場条件に応じて調整することができます.
戦略リスク
- 遅延リスク:SMAと長期の回帰期の使用により,信号遅延を引き起こす可能性があります.
- 偽の突破の危険性: 波動的な市場では誤ったシグナルが生じる可能性があります.
- 市場環境依存: 傾向がはっきりしない市場では不良な結果が出る可能性があります.
- パラメータの感受性: 策略の性能に大きな影響を与える値設定.
戦略最適化の方向性
- 動的値調整:市場の波動的動態に応じて高低点値の調整が可能.
- 補助指標の追加:他の技術指標と組み合わせた信号の信頼性を向上させる.
- ストップ・メカニズムを導入する: リスクを制御するために動的ストップ・メカニズムを設定する.
- 市場環境のフィルター: 市場環境の判断論理を追加し,適切な環境で戦略を実行する.
要約する
これは,取引量分析に基づく中長期トレンド追跡戦略で,取引量差の歴史的高低を分析して市場トレンドを捉える.戦略の設計は合理的で,リスクは管理されているが,市場環境の適応性やパラメータ最適化の問題を注意する必要がある.提案された最適化方向によって,戦略はさらに向上する余地がある.
ストラテジーソースコード
/*backtest
start: 2024-02-20 00:00:00
end: 2025-02-17 08:00:00
period: 2h
basePeriod: 2h
exchanges: [{"eid":"Futures_Binance","currency":"BTC_USDT"}]
*/

//@version=5
strategy("Delta SMA 1-Year High/Low Strategy", overlay = false, margin_long = 100, margin_short = 100)

// Inputs
delta_sma_length = input.int(14, title="Delta SMA Length", minval=1)  // SMA length for Delta
lookback_days = 365  // Lookback period fixed to 1 year

// Function to calculate buy and sell volume
buy_volume = close > open ? volume : na
sell_volume = close < open ? volume : na

// Calculate the Delta
delta = nz(buy_volume, 0) - nz(sell_volume, 0)

// Calculate Delta SMA
delta_sma = ta.sma(delta, delta_sma_length)

// Lookback period in bars (1 bar = 1 day)
desired_lookback_bars = lookback_days

// Ensure lookback doesn't exceed available historical data
max_lookback_bars = math.min(desired_lookback_bars, 365)  // Cap at 365 bars (1 year)

// Calculate Delta SMA low and high within the valid lookback period
delta_sma_low_1yr = ta.lowest(delta_sma, max_lookback_bars)
delta_sma_high_1yr = ta.highest(delta_sma, max_lookback_bars)

// Define thresholds for buy and sell conditions
very_low_threshold = delta_sma_low_1yr * 0.7
above_70_threshold = delta_sma_high_1yr * 0.9
below_60_threshold = delta_sma_high_1yr * 0.5

// Track if `delta_sma` was very low and persist the state
var bool was_very_low = false
if delta_sma < very_low_threshold
    was_very_low := true
if ta.crossover(delta_sma, 10000)
    was_very_low := false  // Reset after crossing 0

// Track if `delta_sma` crossed above 70% of the high
var bool crossed_above_70 = false
if ta.crossover(delta_sma, above_70_threshold)
    crossed_above_70 := true
if delta_sma < below_60_threshold*0.5 and crossed_above_70
    crossed_above_70 := false  // Reset after triggering sell

// Buy condition: `delta_sma` was very low and now crosses 0
buy_condition = was_very_low and ta.crossover(delta_sma, 0)

// Sell condition: `delta_sma` crossed above 70% of the high and now drops below 60%
sell_condition = crossed_above_70 and delta_sma < below_60_threshold

// Place a long order when buy condition is met
if buy_condition
    strategy.entry("Buy", strategy.long)

// Place a short order when sell condition is met
if sell_condition
    strategy.close("Buy")

// Plot Delta SMA and thresholds for visualization
plot(delta_sma, color=color.blue, title="Delta SMA")
plot(very_low_threshold, color=color.green, title="70% of 1-Year Delta SMA Low", linewidth=2)
plot(above_70_threshold, color=color.purple, title="70% of 1-Year Delta SMA High", linewidth=2)
plot(below_60_threshold, color=color.red, title="60% of 1-Year Delta SMA High", linewidth=2)

// Optional: Plot Buy and Sell signals on the chart
//plotshape(series=buy_condition, title="Buy Signal", location=location.belowbar, color=color.new(color.green, 0), style=shape.labelup, text="BUY")
//plotshape(series=sell_condition, title="Sell Signal", location=location.abovebar, color=color.new(color.red, 0), style=shape.labeldown, text="SELL")