ハイブリッドフィボナッチモメンタム移動平均クロスオーバー戦略

MA SMA TP SL FIBONACCI
作成日: 2025-02-19 11:02:16 最終変更日: 2025-02-19 11:02:16
コピー: 3 クリック数: 479
1
フォロー
1617
フォロワー

ハイブリッドフィボナッチモメンタム移動平均クロスオーバー戦略

概要

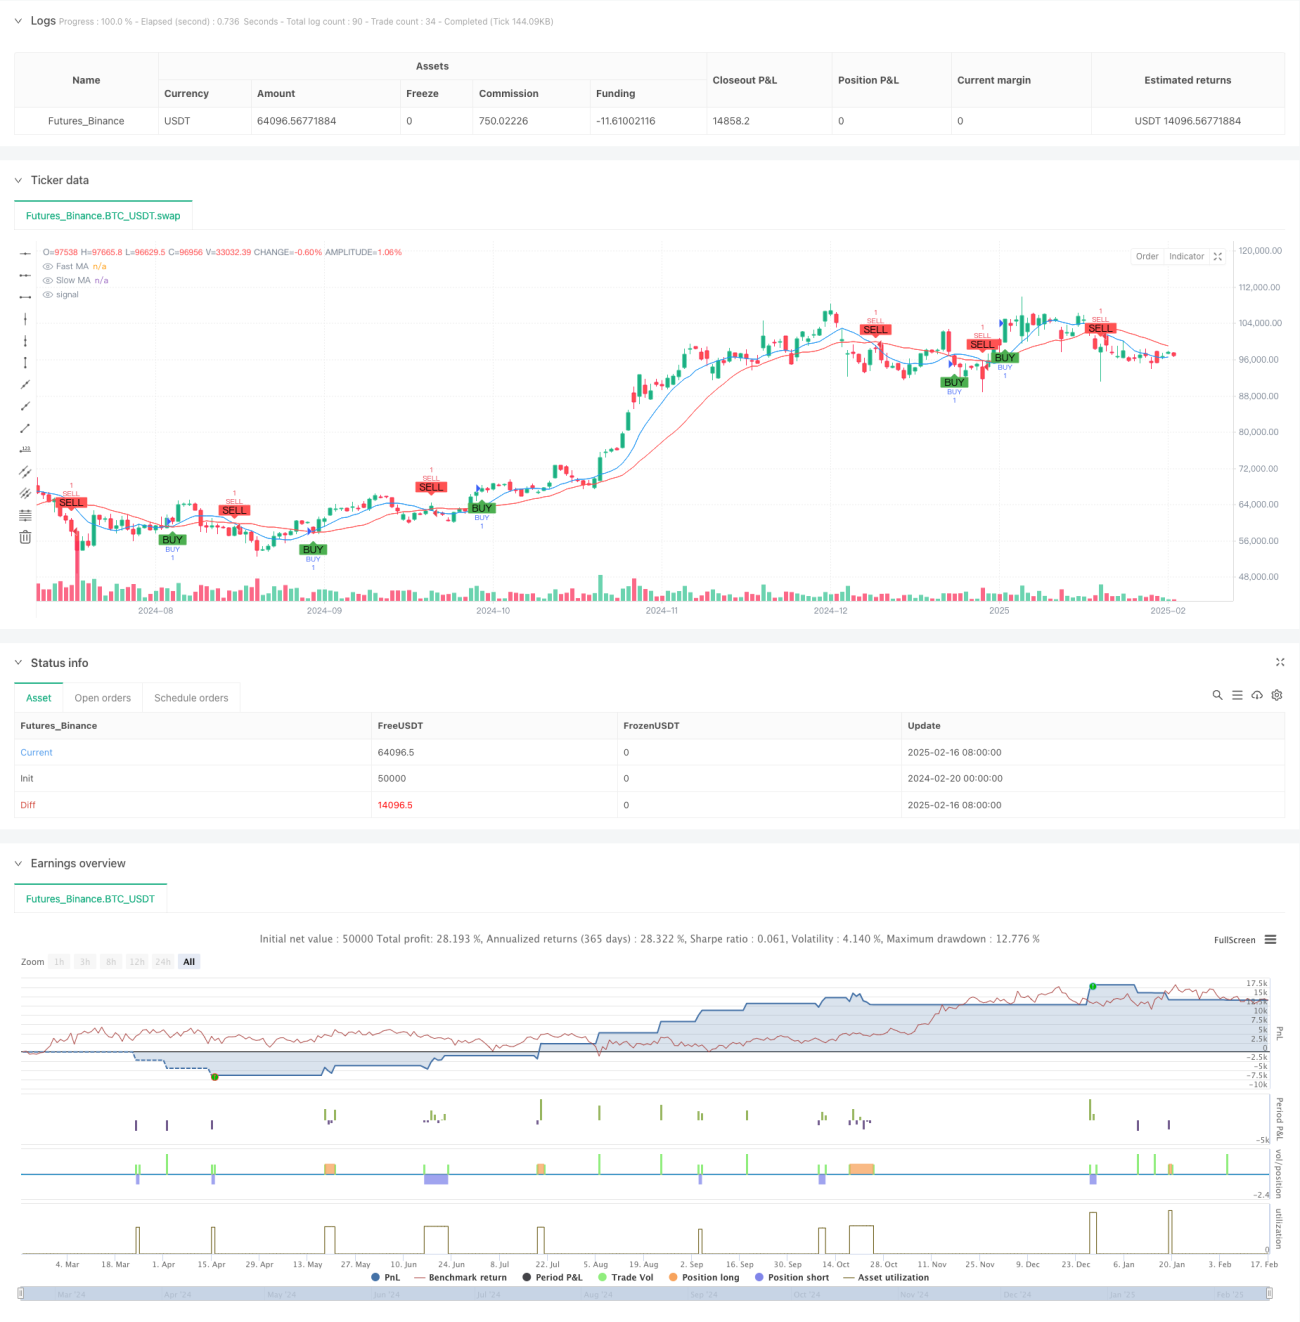
この戦略は,フィボナッチの逆転レベル,移動平均線交差,動量トレンド判断を組み合わせた総合的な取引システムである.それは,速い移動平均線と遅い移動平均線交差を介して取引信号を生成し,重要な価格参照点としてフィボナッチの逆転レベルを使用し,トレンド判断を組み合わせて取引タイミングを最適化します.システムは,リスク管理を実現するために,百分位のストップとストップの設定も統合しています.

戦略原則

戦略の中核となるロジックは、次の主要な要素に基づいています。

  1. 移動平均線交差システムは,9日と21日の単純な移動平均線 ((SMA) を信号指標として使用する
  2. 100サイクルで計算されたフィボナッチ・リトラクションレベル ((23.6%,38.2%,50%,61.8%) は,市場構造分析に使用される
  3. 価格と急速平均線の位置関係による市場動向の判断
  4. 倉庫建設の信号は,高速平均線上をゆっくり平均線に突破して ((多めにする) または下をゆっくり平均線に突破して ((空きをする) によって誘発される
  5. システムが自動的に,入場価格に基づく ストップ・ローズと ストップ・ストップの割合を設定します.

戦略的優位性

  1. 多次元分析:技術分析において最も認知されている3つの要素 (トレンド,動力,価格レベル) を組み合わせる
  2. リスク管理の改善: 既定のストップ・ストップ比率により,資金の安全性を確保
  3. 高可視化:すべての重要な価格レベルと取引シグナルをグラフで明確に表示
  4. 適応性:異なる市場環境にパラメータで適応できる
  5. 操作ルールは明確:信号生成条件は明確で,主観的な判断は避けられる.

戦略リスク

  1. モバイル均線システムは,波動的な市場において偽信号を生成する可能性がある
  2. 固定パーセンテージのストップ・ストップ設定は,すべての市場環境に適していない可能性があります.
  3. 価格が急激に変動する市場では,価格が急激にストップポイントを突破する可能性があります.
  4. フィボナッチ水準の有効性は,市場の状況の変化に合わせて変化する可能性があります.
  5. トレンド判断は市場転換点に遅れをとる可能性がある

戦略最適化の方向性

  1. 波動率指標を導入し,ストップ・ストップ・レシオンの動的調整
  2. 取引量分析を追加して取引信号を確認する
  3. 異なる時間周期での確認を考慮して信号の信頼性を向上させる
  4. 適切な市場条件で取引する
  5. 適応性のあるパラメータ最適化システムを開発

要約する

これは,いくつかのクラシックな技術分析ツールを融合した総合的な取引戦略である. 移動平均線,フィボナッチ・リトラクション,トレンド分析を組み合わせることで,戦略は,市場で潜在的な取引機会を捉えることができる. 同時に,完善したリスク管理システムと明確なビジュアルなインターフェースが,優れた実用性を有する.

ストラテジーソースコード
/*backtest
start: 2024-02-20 00:00:00
end: 2025-02-17 08:00:00
period: 1d
basePeriod: 1d
exchanges: [{"eid":"Futures_Binance","currency":"BTC_USDT"}]
*/

//@version=5
strategy("Buy/Sell Strategy with TP, SL, Fibonacci Levels, and Trend", overlay=true)

// Input for stop loss and take profit percentages
stopLossPercentage = input.int(2, title="Stop Loss (%)") // Stop loss percentage
takeProfitPercentage = input.int(4, title="Take Profit (%)") // Take profit percentage

// Example of a moving average crossover strategy
fastLength = input.int(9, title="Fast MA Length")
slowLength = input.int(21, title="Slow MA Length")

fastMA = ta.sma(close, fastLength)
slowMA = ta.sma(close, slowLength)

// Entry conditions (Buy when fast MA crosses above slow MA, Sell when fast MA crosses below slow MA)
longCondition = ta.crossover(fastMA, slowMA)
shortCondition = ta.crossunder(fastMA, slowMA)

// Plot moving averages for visual reference
plot(fastMA, color=color.blue, title="Fast MA")
plot(slowMA, color=color.red, title="Slow MA")

// Fibonacci Retracement Levels
lookback = input.int(100, title="Lookback Period for Fibonacci Levels")
highLevel = ta.highest(high, lookback)
lowLevel = ta.lowest(low, lookback)

fib236 = lowLevel + (highLevel - lowLevel) * 0.236
fib382 = lowLevel + (highLevel - lowLevel) * 0.382
fib50 = lowLevel + (highLevel - lowLevel) * 0.5
fib618 = lowLevel + (highLevel - lowLevel) * 0.618

// Display Fibonacci levels as text on the chart near price panel (left of candle)
label.new(bar_index, fib236, text="Fib 23.6%: " + str.tostring(fib236, "#.##"), style=label.style_label_left, color=color.purple, textcolor=color.white, size=size.small, xloc=xloc.bar_index, yloc=yloc.price)
label.new(bar_index, fib382, text="Fib 38.2%: " + str.tostring(fib382, "#.##"), style=label.style_label_left, color=color.blue, textcolor=color.white, size=size.small, xloc=xloc.bar_index, yloc=yloc.price)
label.new(bar_index, fib50, text="Fib 50%: " + str.tostring(fib50, "#.##"), style=label.style_label_left, color=color.green, textcolor=color.white, size=size.small, xloc=xloc.bar_index, yloc=yloc.price)
label.new(bar_index, fib618, text="Fib 61.8%: " + str.tostring(fib618, "#.##"), style=label.style_label_left, color=color.red, textcolor=color.white, size=size.small, xloc=xloc.bar_index, yloc=yloc.price)

// Trend condition: Price uptrend or downtrend
trendCondition = close > fastMA ? "Uptrending" : close < fastMA ? "Downtrending" : "Neutral"

// Remove previous trend label and add new trend label
var label trendLabel = na
if (not na(trendLabel))
    label.delete(trendLabel)

// Create a new trend label based on the current trend
trendLabel := label.new(bar_index, close, text="Trend: " + trendCondition, style=label.style_label_left, color=color.blue, textcolor=color.white, size=size.small, xloc=xloc.bar_index, yloc=yloc.price)

// Buy and Sell orders with Stop Loss and Take Profit
if (longCondition)
    // Set the Stop Loss and Take Profit levels based on entry price
    stopLossLevel = close * (1 - stopLossPercentage / 100)
    takeProfitLevel = close * (1 + takeProfitPercentage / 100)
    // Enter long position with stop loss and take profit levels
    strategy.entry("BUY", strategy.long)
    strategy.exit("Sell", "BUY", stop=stopLossLevel, limit=takeProfitLevel)
    
    // Display TP, SL, and Entry price labels on the chart near price panel (left of candle)
    label.new(bar_index, takeProfitLevel, text="TP\n" + str.tostring(takeProfitLevel, "#.##"), style=label.style_label_left, color=color.green, textcolor=color.white, size=size.small, xloc=xloc.bar_index, yloc=yloc.price)
    label.new(bar_index, stopLossLevel, text="SL\n" + str.tostring(stopLossLevel, "#.##"), style=label.style_label_left, color=color.red, textcolor=color.white, size=size.small, xloc=xloc.bar_index, yloc=yloc.price)
    label.new(bar_index, close, text="BUY\n" + str.tostring(close, "#.##"), style=label.style_label_left, color=color.blue, textcolor=color.white, size=size.small, xloc=xloc.bar_index, yloc=yloc.price)

if (shortCondition)
    // Set the Stop Loss and Take Profit levels based on entry price
    stopLossLevel = close * (1 + stopLossPercentage / 100)
    takeProfitLevel = close * (1 - takeProfitPercentage / 100)
    // Enter short position with stop loss and take profit levels
    strategy.entry("SELL", strategy.short)
    strategy.exit("Cover", "SELL", stop=stopLossLevel, limit=takeProfitLevel)
    
    // Display TP, SL, and Entry price labels on the chart near price panel (left of candle)
    label.new(bar_index, takeProfitLevel, text="TP\n" + str.tostring(takeProfitLevel, "#.##"), style=label.style_label_left, color=color.green, textcolor=color.white, size=size.small, xloc=xloc.bar_index, yloc=yloc.price)
    label.new(bar_index, stopLossLevel, text="SL\n" + str.tostring(stopLossLevel, "#.##"), style=label.style_label_left, color=color.red, textcolor=color.white, size=size.small, xloc=xloc.bar_index, yloc=yloc.price)
    label.new(bar_index, close, text="SELL\n" + str.tostring(close, "#.##"), style=label.style_label_left, color=color.orange, textcolor=color.white, size=size.small, xloc=xloc.bar_index, yloc=yloc.price)

// Plot Buy/Sell labels on chart
plotshape(series=longCondition, title="BUY Signal", location=location.belowbar, color=color.green, style=shape.labelup, text="BUY")
plotshape(series=shortCondition, title="SELL Signal", location=location.abovebar, color=color.red, style=shape.labeldown, text="SELL")