
1
Follow
1781
Followers
概要
この戦略は,ブルイン帯の突破と<unk>線形態に基づくトレンド追跡取引システムである.この戦略は,ブルイン帯を突破した連続した3つの<unk>線を識別し,<unk>線実体内のクローズアップ価格の位置と組み合わせて取引シグナルを決定する.このシステムは,1:1の固定的リスク/利益比率を使用して,各取引のストップとストップを管理する.
戦略原則
戦略の中核となるロジックは、次の主要な要素に基づいています。
- 20周期のブリン帯を主要指標として使用し,標準差倍数は2.0である.
- 多頭入場条件:連続した3つのK線の閉盘価格が軌道上を突破し,この3つのK線は陽線であり,閉盘価格は実体上半部分に位置する
- 空頭入場条件:連続した3つのK線の閉盘価格が下線を突破し,この3つのK線は陰線であり,閉盘価格は実体下半部に位置する
- ストップダストは,最初の信号のK線の極限値に設定されます.
- ストップポジションを設定するリスクと利益の1:1の比率
戦略的優位性
- 複数の確認メカニズムを使用し,連続した3つのK線突破の形状要求により,偽突破のリスクを効果的に軽減します.
- 閉盤価格のK線実体内の位置判断と組み合わせることで,トレンド確認の信頼性が強化される
- 固定リスク/収益比率を用いてポジションを管理し,リスク管理を容易にする
- 戦略ロジックは明確で、理解しやすく、実行しやすい
- ターゲティング機能により取引信号を直視的に表示し,追跡分析を容易にします.
戦略リスク
- 不安定な市場では誤ったシグナルが頻繁に発生する可能性がある
- 固定リスク/利益の比率は,強いトレンドを十分に把握できない
- 3つの連続したK線を厳格に要求すると,いくつかの潜在的好機が失われる可能性があります.
- 止損は信号K線極値で設定され,波動が大きい場合止損位置が遠すぎる
リスク管理には以下の方法が推奨されています.
- 市場波動周期に合わせてブリン帯のパラメータ調整
- 市場特有の動向に合わせて調整されたリスク/利益比率
- トレンド確認インジケーターを追加する
- ストップ・ローズ設定の最適化方法
戦略最適化の方向性
- パラメータ最適化:
- ブリン帯周期と標準差倍数は,異なる市場特性の動向に応じて調整できます.
- K 線の3つの要求を動的判断に変換することを検討する
- 信号の最適化:
- ADXやトレンドラインのようなトレンド確認指標を追加する
- 交付確認メカニズムを導入
- 振動指標を補助として追加することを検討
- ポジション管理の最適化:
- 動的なリスク/利益の設定を実現する
- 資金管理モジュールを追加
- 貯蔵庫の建設を検討する
- ストップ・ローズ・オプティマイゼーション
- 追跡・止損メカニズムを導入する
- ATR 設定による止損距離
- 時間の無駄を考える
要約する
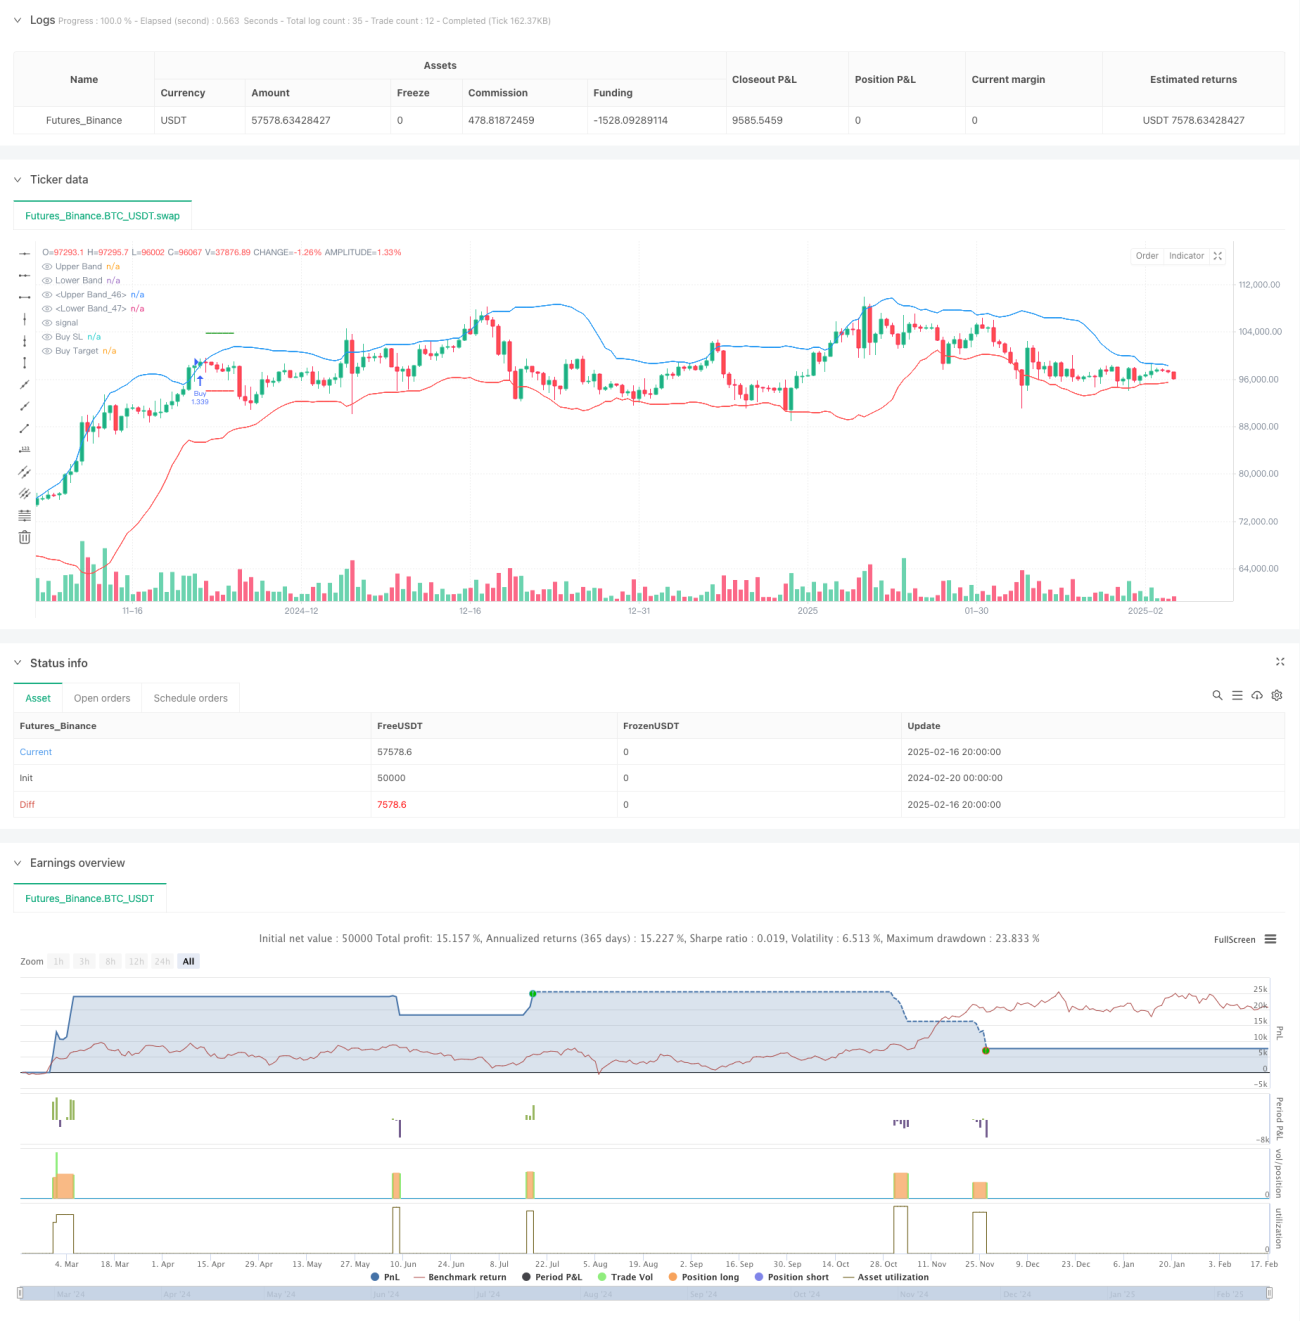
これは,構造が整った,論理が明確なトレンド追跡戦略である。ブリン帯突破と<unk>線形態の複数の確認機構により,偽信号のリスクを効果的に低減する。固定的リスク・利益比設定は取引管理を簡素化するが,戦略の柔軟性を制限する。パラメータ設定を最適化,確認指標を追加し,ポジション管理を改良するなど,戦略の改善余地はまだ大きい。全体的に,これは実用的な価値のある基本戦略枠組みであり,具体的なニーズに応じてさらに完善することができる。
Source
Pine
/*backtest
start: 2024-02-20 00:00:00
end: 2025-02-17 08:00:00
period: 12h
basePeriod: 12h
exchanges: [{"eid":"Futures_Binance","currency":"BTC_USDT"}]
*/

//@version=6
strategy("Bollinger Band Strategy (Close Near High/Low Relative to Half Range)", overlay=true, default_qty_type=strategy.percent_of_equity, default_qty_value=200, pyramiding=0)

// Bollinger BandsStrategy parameters
Related strategies
Comment
All comments (0)
No data
- 1