マルチインジケータートレンド追跡強化定量取引戦略

1
Follow
1781
Followers
概要
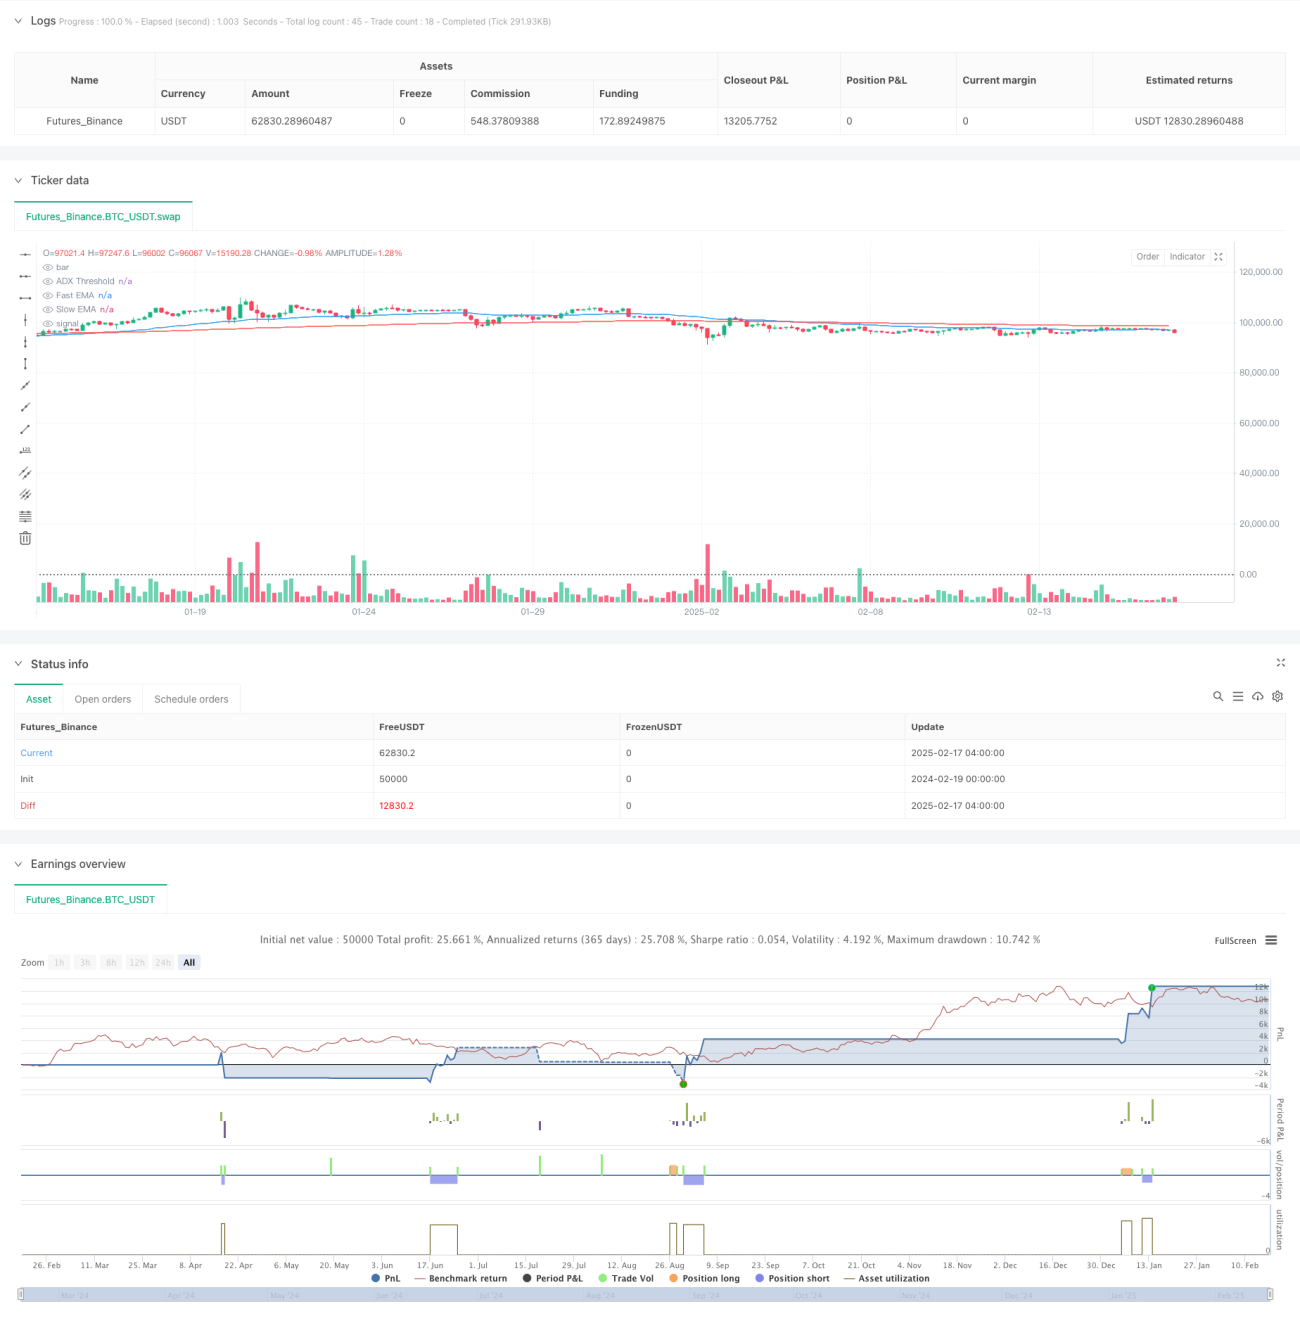
この戦略は,移動平均 ((EMA),平均トレンド指数 ((ADX) と相対的に強い指標 ((RSI) など,複数の技術指標を統合した複数の技術指標に基づくトレンド追跡戦略であり,複数の時間枠分析方法と組み合わせています. この戦略は,主に,急速なEMAと遅いEMAの交差によってトレンドの方向性を確認し,ADXを使用してトレンドの強さをフィルターし,RSIによって市場の動きを判断し,1分間のグラフで高頻度で取引します.
戦略原則
戦略は以下の核心的なメカニズムに基づいています.
- 50周期と200周期のEMAを使用してトレンドの方向を識別し,快線と慢線の交差によって入場信号を確認する
- ADX指標 ((14サイクル) を用いてトレンドの強さを評価し,ADXが25以上である時にのみ入場し,震動市場を避ける
- RSI指標 ((14サイクル) と組み合わせた動力分析を行い,RSIが30を下回るとオッズを考慮し,70を超えると空調を考慮する
- 4時間枠のEMA分析を導入し,多時間枠の確認によりトレンド判断の信頼性を強化
- ダイナミックストップストロップを設定し,多時ストップストップは入場価格の5%で,ストップストロップは2%で設定する.空調は逆に設定する.
戦略的優位性
- 複数の指標のクロス検証により,信号の信頼性が著しく向上
- ダイナミック・ストップと波動性に基づくポジション管理を含む,十分なリスク管理メカニズム
- マルチタイムフレーム分析により,偽侵入のリスクを低減する
- 高得率と中程度の損益率,期待される好利益
- 戦略ロジックは明確で、理解しやすく、維持しやすい
戦略リスク
- 市場が急激に波動すると,ストップ・ロスの効果が低下する可能性があります.
- 横軸の変動は取引頻度や取引コストを増加させる可能性があります.
- EMA指数自体は遅滞しており,最高の入場時間を逃している可能性があります.
- 複数の指標は矛盾する信号を生む
- 1分周期取引は実行速度要求が高く,滑り場リスクがある
戦略最適化の方向性
- ADX平滑パラメータを最適化し,トレンド認識の正確性を向上させる
- ATRベースのダイナミックなポジション管理を導入し,市場の変動に適応する
- ボリューム分析の次元を増やし、信号の信頼性を向上
- 市場環境の分類を追加し,異なる市場条件で異なるパラメータの組み合わせを使用することを検討する
- 機械学習のアルゴリズムを統合し,パラメータの選択を最適化することができます.
要約する
この戦略は,複数の技術指標の協調的な配合によって,堅実なトレンド追跡システムを構築した.戦略は,高い勝率を維持しながら,完善したリスク管理機構によって,かなりの利益を達成した.ある程度の最適化の余地があるが,全体的なパフォーマンスは満足のいくもので,安定した利益を追求するトレーダーに特に適している.
Source
Pine
/*backtest
start: 2024-02-19 00:00:00
end: 2025-02-17 08:00:00
period: 4h
basePeriod: 4h
exchanges: [{"eid":"Futures_Binance","currency":"BTC_USDT"}]
*/

//@version=5
strategy("Enhanced Trend Following Strategy", overlay=true, default_qty_type=strategy.percent_of_equity, default_qty_value=200)

// === INPUTS ===Strategy parameters
Related strategies
Comment
All comments (0)
No data
- 1