マルチインジケーターダイナミックトレンドクロスオーバー定量取引戦略

1
Follow
1781
Followers
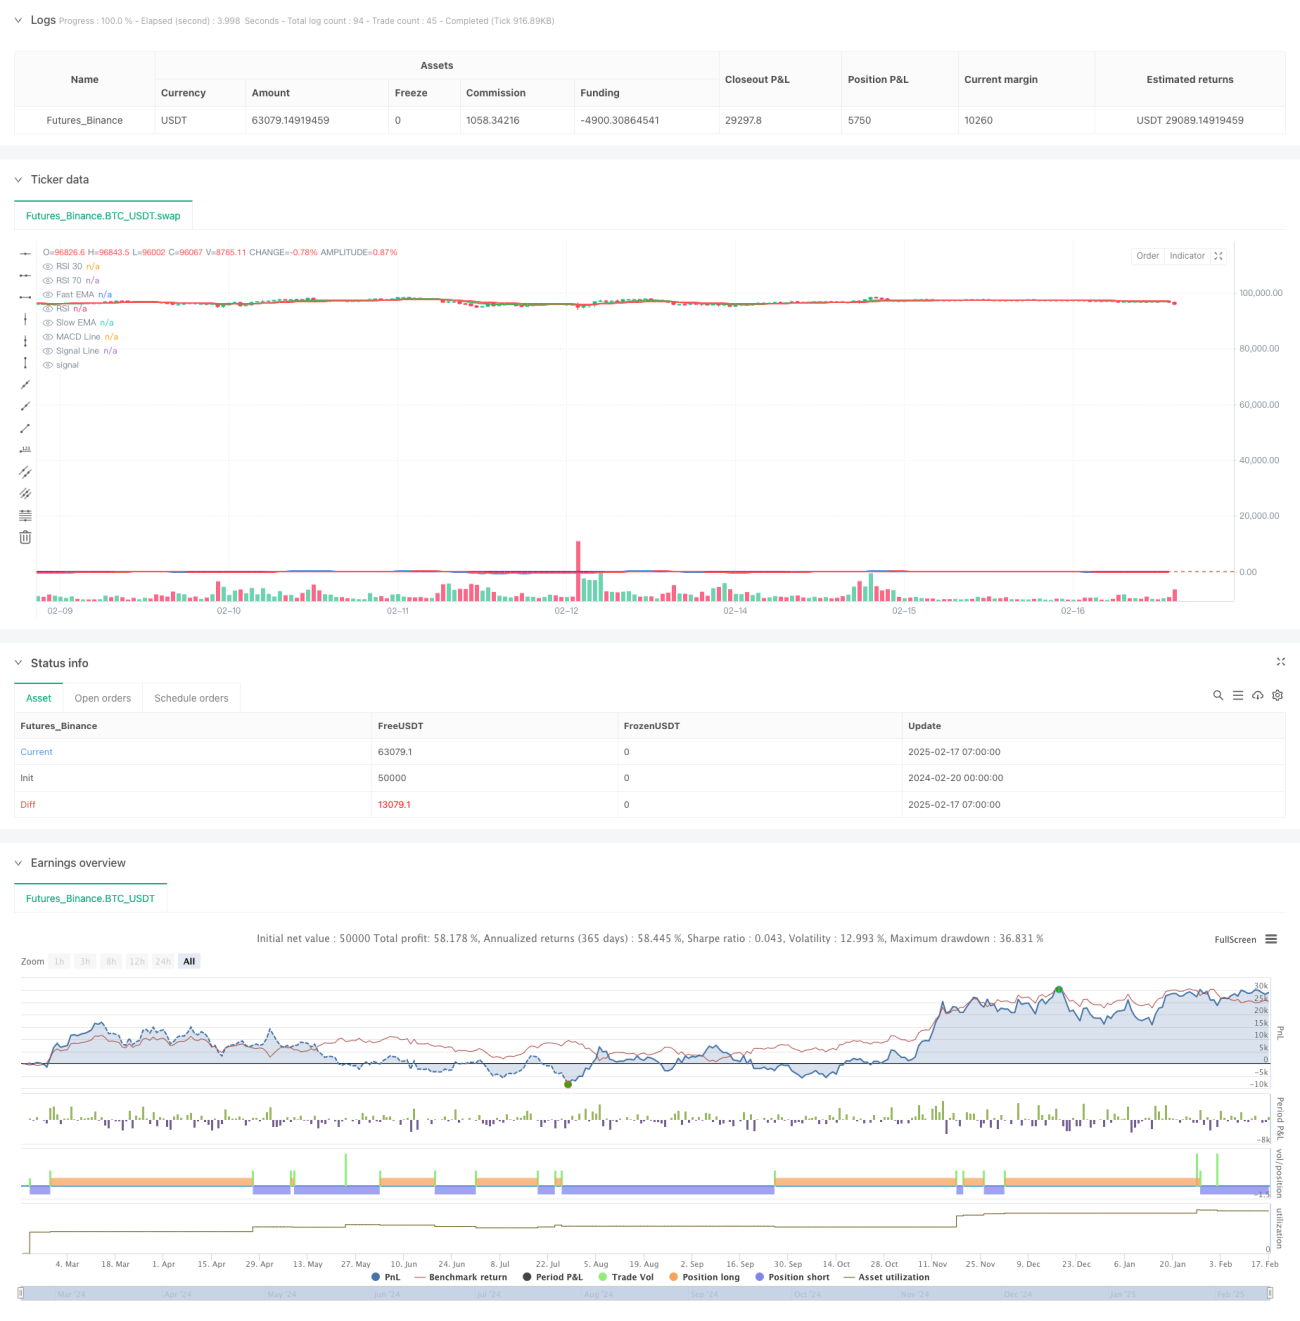
概要
この戦略は,複数の技術指標に基づくトレンド追跡取引システムであり,移動平均 (EMA),移動平均の散乱 (MACD) および相対的に強い指標 (RSI) の3つのクラシック技術指標を組み合わせて,市場の傾向の変化と動力を捉えることで取引を行う.この戦略は,高速EMA9周期 (EMA9周期) と遅いEMA21周期 (EMA21周期),MACD12,26,9周期) とRSI14などのパラメータ設定を採用し,指標が交差点と<unk>値を破るときに取引信号を発する.
戦略原則
戦略の核心的な論理は,複数の技術指標の協調的な確認によって市場のトレンドの転換点を認識することです.具体的には,以下の3つの側面の信号確認が含まれています:
- EMA交差信号:高速EMAを上向きに横切ると多信号,下向きに横切ると空信号とみなされる.
- MACD交差信号:MACD線が信号線を上を横切るときは多し確認し,下を横切るときは空し確認する.
- RSIフィルター:RSI値が30-70の範囲にあるときに取引を許可し,過剰な超買い超売り領域の取引を避ける.
3つの指標が同時に同方向の信号を発した場合にのみ,戦略は対応する取引操作を実行する.
戦略的優位性
- マルチメーターのクロス検証により,偽信号の影響を効果的に軽減する.
- トレンドトラッキングと動態指標の組み合わせにより,市場の転換点をより正確に捉えることができます.
- RSIフィルタリングは,過剰な超買いと超売りの区域取引を防ぐことができます.
- 戦略の論理が明確で,パラメータの調整と最適化が容易である.
- 異なる市場環境に適応するために,多価と空価の取引を同時に行うことができます.
戦略リスク
- 多重指標確認は,信号の遅延や最適な入場時間を逃す可能性があります.
- 横盤振動市場では,頻繁に交差信号が生じ,取引コストが増加する可能性があります.
- 固定RSIの<unk>値は,異なる市場環境で柔軟性がない可能性があります.
- ストップ・アンド・ストップ・メカニズムが設定されていない場合,大幅な変動で大きな損失を負う可能性があります.
- 技術指標のパラメータの選択は,十分な歴史的データによる検証が必要です.
戦略最適化の方向性
- 市場変動に応じて動的に調整する自己適応の指標パラメータを導入する.
- 単一取引のリスクを制御するストップ・ストップ・メカニズムを追加しました.
- 取引量指標の検証を増やし,信号の信頼性を向上させる.
- 市場環境認識モジュールを開発し,異なる市場状態で異なる取引パラメータを採用する.
- 資金管理モジュールを導入し,口座のリスクの動向に応じてポジションのサイズを調整します.
- トレンドの強さをフィルターして,弱いトレンドで取引することを避ける.
要約する
この戦略は,複数の技術指標のクロス検証によって市場トレンドの変化を捉え,信頼性と適応性が優れている.しかし,実際の適用では,信号遅延や過剰取引などの問題には注意が必要であり,適応パラメータ,ストップダストメカニズム,市場環境認識などの導入により,戦略の安定性と収益性を高めるために最適化することが推奨されている.使用過程で,十分な歴史的データ復元とパラメータの最適化が行われ,実際の取引効果に応じて継続的に調整および改善することが推奨されている.
Source
Pine
Strategy parameters
Related strategies
Comment
All comments (0)
No data
- 1