ダイナミックウェーブクラウドトレンドATRストップロス戦略
Ichimoku Cloud ATR Senkou Span CHIKOU SPAN SMA
作成日:
2025-02-19 17:04:21
最終変更日:
2025-02-27 17:54:39
コピー:
1
クリック数:
564
2
フォロー
455
フォロワー
概要
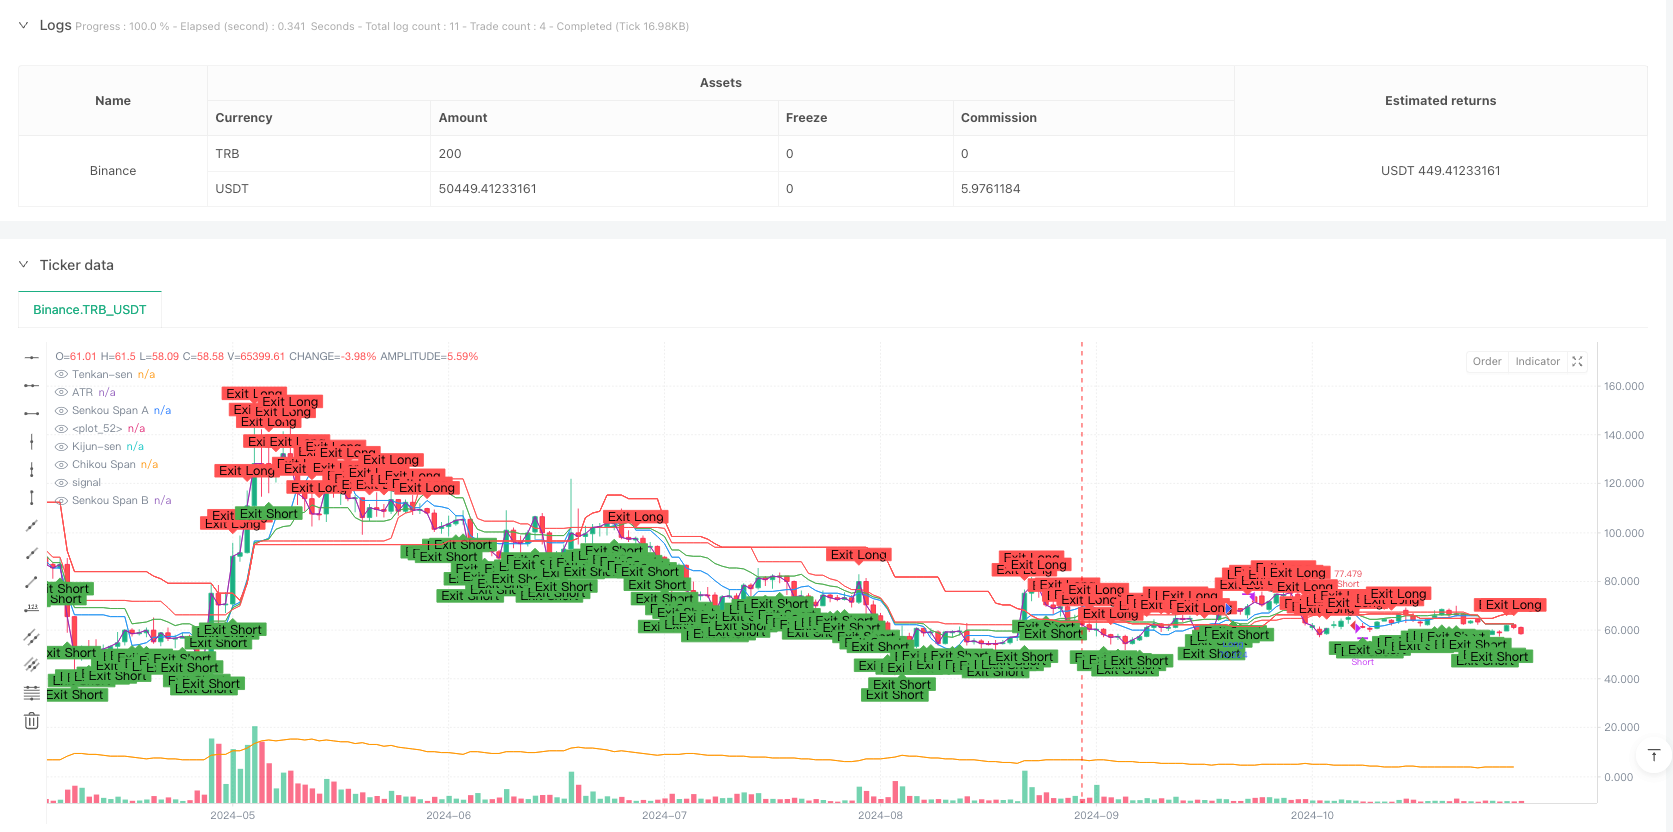
この戦略は,一目平衡図 ((Ichimoku Cloud) と実際の波動幅の平均値 ((ATR) を組み合わせた完全な取引システムである.それは,雲図の構成要素を通じて市場のトレンドを認識し,同時にATRを利用して,動的にストップロスを調整し,トレンド追跡とリスク管理の有機的な組み合わせを実現している.この戦略は,動力と波動率の2つの次元である市場情報を融合させ,取引決定のための総合的な分析の枠組みを提供する.
戦略原則
戦略の核心的な論理は,一目均衡図の5つの線とATR指標の上に構築されている.システムは,変換線 ((Tenkan-Sen) と基調線 ((Kijun-Sen) の交差によって取引シグナルを誘発し,同時に価格が雲の正しい側 ((Senkou Span AとB) に位置することを要求し,遅延線 ((Chikou Span) によって確認される.具体的には:
- 多条件: 変換線が基準線を横切る,価格がクラウドの上,延期線が現在の閉店価格上
- 空白条件: 変換線が基準線を横断し,価格が雲の下,延期線が現在の閉店価格の下
- ストップダスト設定:ATRの倍数で動的に調整,デフォルトは1.5倍ATR
- 出力条件:逆の交差信号または遅延線位置の変化
戦略的優位性
- 多次元確認:トレンド,動量,波動率の多次元市場情報を組み合わせ,信号の信頼性を高めます
- ダイナミックなリスク管理:ATRベースのストップ設定は,市場の波動性に応じて自動的に調整され,固定ストップの欠陥を回避します.
- システム化: 取引の規則が明確で,取引の一貫性と規律性が保たれる
- 視覚的直観: クラウドグラフの視覚的な表示により,トレーダーは市場構造を直観的に理解できます.
- 適応性:様々な市場環境に適応するためにパラメータを調整できます
戦略リスク
- 遅滞のリスク:一見均衡図の指標は,それ自体には遅滞があるため,入場時間の遅れを引き起こす可能性がある
- 横盤の振動で偽の突破信号が生じる可能性
- パラメータ感度: 異なる期間のパラメータ設定は戦略のパフォーマンスに大きな影響を与える可能性があります。
- 止損幅度:ATR倍数の選択は,保護と利益の余地とのバランスを必要とする
- 信号の頻度: 厳格な入場条件により,取引機会が比較的少ない可能性があります.
戦略最適化の方向性
- トレンド強度フィルターを導入: トレンド強度を測定するADXなどの指標を追加し, 弱いトレンド環境をフィルタリングできます.
- 最適化ストップ・メカニズム:ストップ・ポイントを雲のエッジまたは重要なサポート/レジスタンスポイントに配置することを考慮する
- タイムフィルターを増やす:重要な経済データの発表などの高波動期を回避する
- 交付量確認を追加:交付量を信号確認の追加条件とする
- 部分的なポジション管理の開発:シグナル強度と市場環境に応じてポジション保持比率を調整
要約する
ダイナミック・ウェーブ・クラウド・トレンドATRストップ戦略は,クラシックな技術分析ツールを融合した完全な取引システムである.それは,一目的な均衡図の複数の確認機構によってトレンドを識別し,ATRを利用して,ダイナミックなリスク制御を行うため,トレーダーに体系的な意思決定の枠組みを提供する.戦略には,一定の遅れやパラメータの感受性の問題があるが,合理的な最適化とリスク管理によって,トレンド市場において安定したパフォーマンスを得ることができる.戦略の可視化特性と明確な規則は,体系的な取引を実践したい投資家にとって特に適している.
ストラテジーソースコード
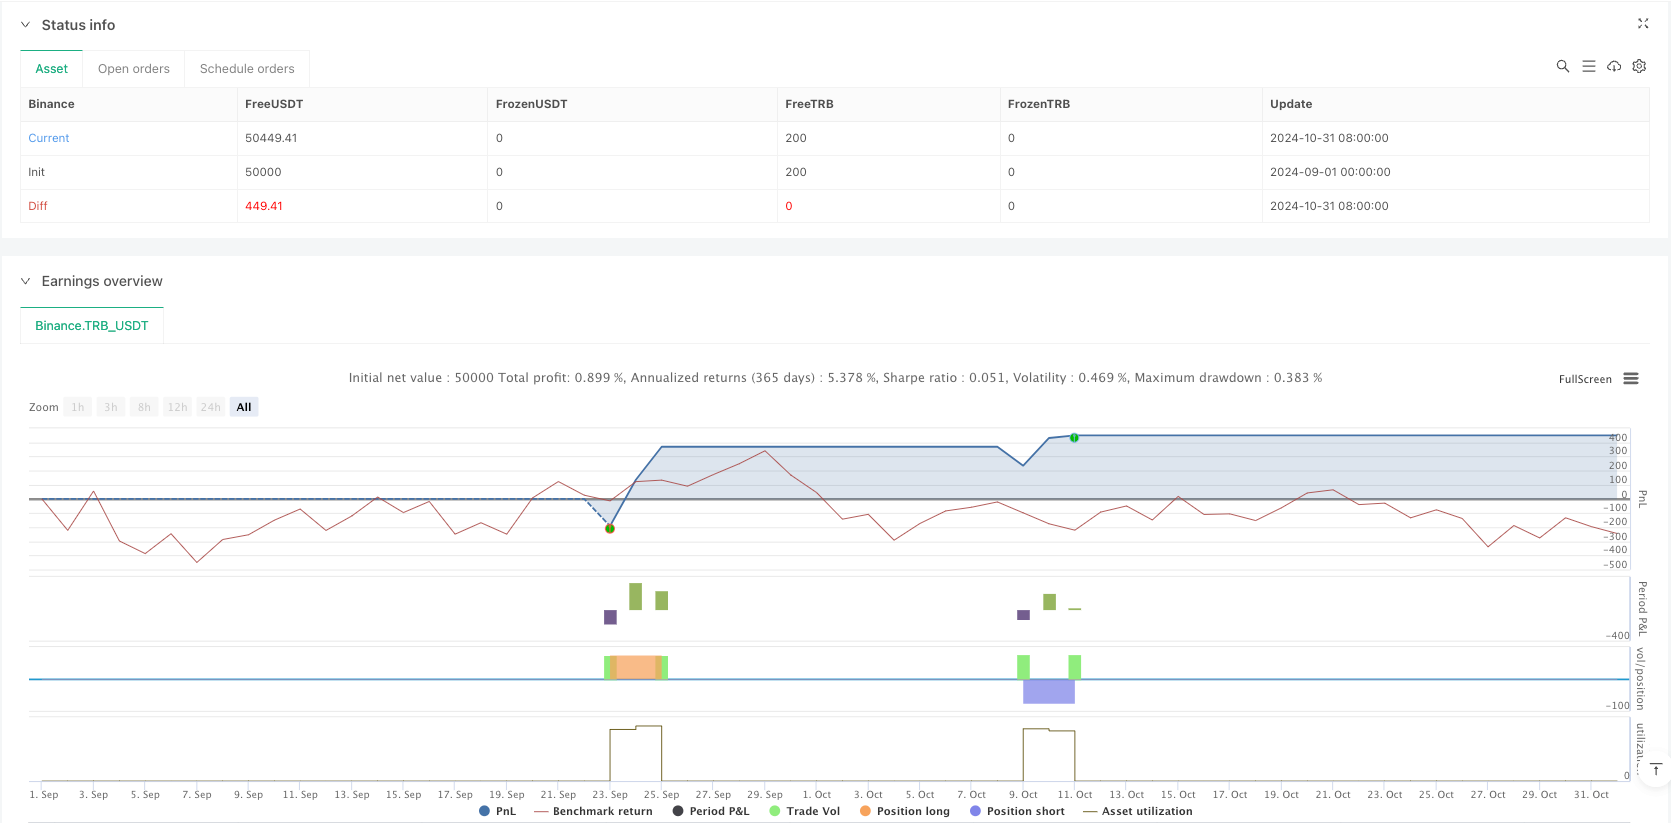
/*backtest
start: 2024-09-01 00:00:00
end: 2025-02-18 00:00:00
period: 1h
basePeriod: 1h
exchanges: [{"eid":"Binance","currency":"TRB_USDT"}]
*/

//@version=5
strategy("Ichimoku Cloud + ATR Strategy", overlay=true, default_qty_type=strategy.percent_of_equity, default_qty_value=10)

// === Inputs ===
conversionPeriods = input.int(9, title="Tenkan-sen Period", minval=1)
basePeriods = input.int(26, title="Kijun-sen Period", minval=1)
laggingSpan2Periods = input.int(52, title="Senkou Span B Period", minval=1)
displacement = input.int(26, title="Displacement", minval=1)
atrLength = input.int(14, title="ATR Period", minval=1)
atrMultiplier = input.float(1.5, title="ATR Multiplier for Stop-Loss", minval=0.1, step=0.1)

// === Indicator Calculations ===
// Ichimoku Cloud
tenkan = (ta.highest(high, conversionPeriods) + ta.lowest(low, conversionPeriods)) / 2
kijun = (ta.highest(high, basePeriods) + ta.lowest(low, basePeriods)) / 2
senkouSpanA = ta.sma((tenkan + kijun) / 2, 1)
senkouSpanB = (ta.highest(high, laggingSpan2Periods) + ta.lowest(low, laggingSpan2Periods)) / 2
chikouSpan = close[displacement]

// ATR
atr = ta.atr(atrLength)

// === Entry Conditions ===
longCondition = ta.crossover(tenkan, kijun) and close > senkouSpanA and close > senkouSpanB and chikouSpan > close
shortCondition = ta.crossunder(tenkan, kijun) and close < senkouSpanA and close < senkouSpanB and chikouSpan < close

// === Entry Signals with Stop-Loss ===
if (longCondition)
    longStop = close - (atrMultiplier * atr)
    strategy.entry("Long", strategy.long)
    strategy.exit("Long Exit", from_entry="Long", stop=longStop)

if (shortCondition)
    shortStop = close + (atrMultiplier * atr)
    strategy.entry("Short", strategy.short)
    strategy.exit("Short Exit", from_entry="Short", stop=shortStop)

// === Exit Conditions ===
exitLongCondition = ta.crossunder(tenkan, kijun) or chikouSpan < close
exitShortCondition = ta.crossover(tenkan, kijun) or chikouSpan > close

if (exitLongCondition)
    strategy.close("Long")

if (exitShortCondition)
    strategy.close("Short")

// === Plotting Indicators on the Chart ===
// Ichimoku Cloud
plot(senkouSpanA, color=color.green, title="Senkou Span A")
plot(senkouSpanB, color=color.red, title="Senkou Span B")
fill(plot(senkouSpanA, color=color.green), plot(senkouSpanB, color=color.red), color=close > senkouSpanA ? color.new(color.green, 90) : color.new(color.red, 90), title="Ichimoku Cloud")

// Tenkan-sen and Kijun-sen
plot(tenkan, color=color.blue, title="Tenkan-sen")
plot(kijun, color=color.red, title="Kijun-sen")

// Chikou Span
plot(chikouSpan, color=color.purple, title="Chikou Span", offset=-displacement)

// ATR (hidden)
plot(atr, color=color.orange, title="ATR", linewidth=1, display=display.none)

// === Signal Visualization ===
// Markers for Long and Short entries
plotshape(series=longCondition, title="Long Entry", location=location.belowbar, color=color.green, style=shape.labelup, text="Long")
plotshape(series=shortCondition, title="Short Entry", location=location.abovebar, color=color.red, style=shape.labeldown, text="Short")

// Markers for Long and Short exits
plotshape(series=exitLongCondition, title="Long Exit", location=location.abovebar, color=color.red, style=shape.labeldown, text="Exit Long")
plotshape(series=exitShortCondition, title="Short Exit", location=location.belowbar, color=color.green, style=shape.labelup, text="Exit Short")