EMAとADX指標を組み合わせたマルチタイムフレームのダイナミックトレンドフォロー戦略

2
Follow
478
Followers
概要
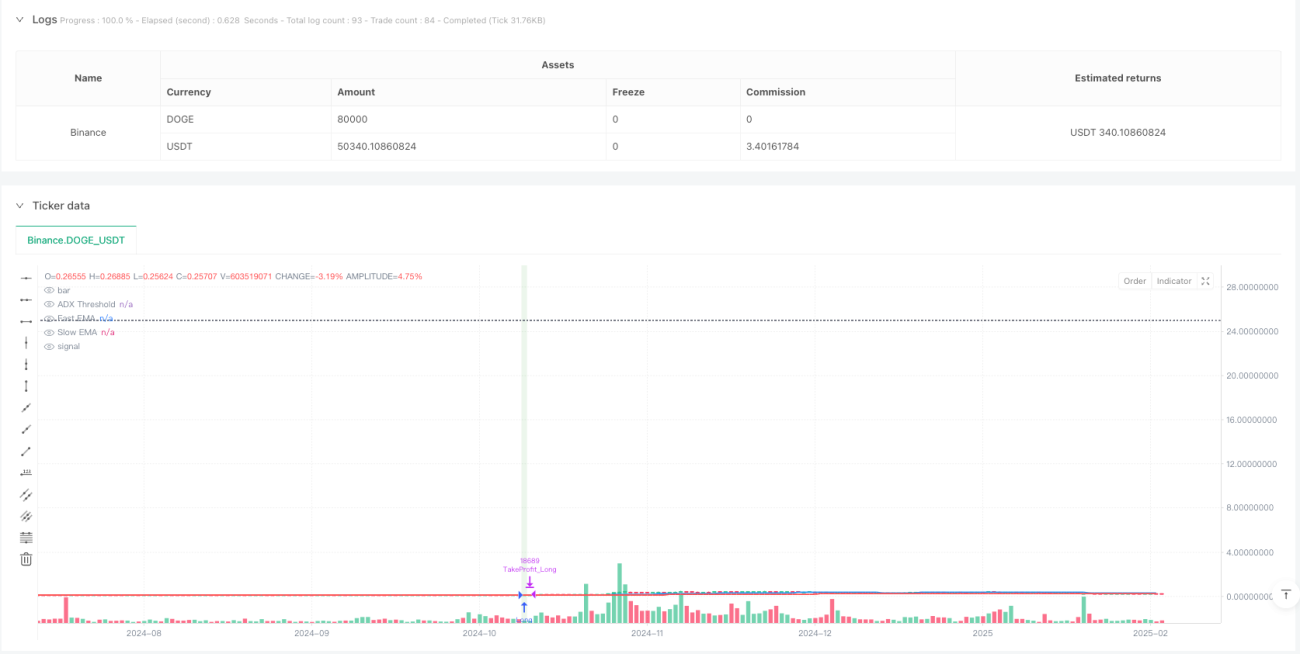
この戦略は,複数の時間枠分析を組み合わせたトレンド追跡取引システムで,指数移動平均 ((EMA),平均トレンド指数 ((ADX) と相対強い指数 ((RSI) など,複数の技術指標を統合して,15分間の時間枠で取引します.戦略は,保守的なポジション管理方法を採用し,各取引のリスクは,長期的に安定した収益を達成するために,口座総額の2%以内で管理されます.
戦略原則
戦略は,急速なEMA ((50サイクル) と遅いEMA ((200サイクル) の交差点を使用してトレンドの方向を識別し,ADX指標と組み合わせてトレンドの強さを確認する.ADX値は25を超えると,市場が強いトレンド状態にあることを示している.RSI指標は,RSI値が70に達すると平仓多頭,RSI値が30に達すると平仓空頭である超買い超売り状態を識別するために使用される.同時に,戦略は,4時間の時間枠にEMA指標を導入し,取引の正確性を向上させるために,より高いレベルのトレンド確認として使用します.
戦略的優位性
- 複数の技術指標の統合により,偽信号の影響が減り,取引の信頼性が向上した.
- 市場変動に応じて柔軟に調整できるダイナミックなストップ・ストップ・損失設定を採用している.
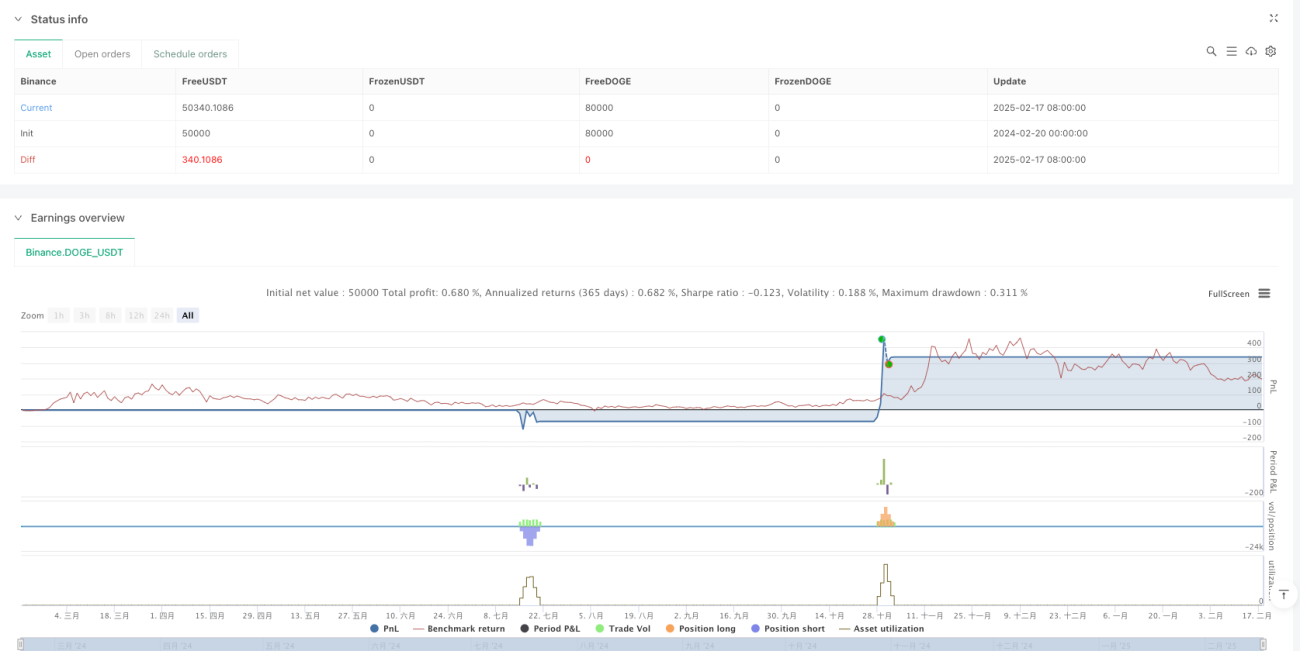
- 保守的なポジション管理戦略 ((2%リスクコントロール) は,撤回リスクを効果的に低減した.
- マルチタイムフレーム分析により,市場動向のより包括的な見方が得られます.
- 戦略再測は62.86%の勝率と1.136の利益因数を示している.
戦略リスク
- 波動的な市場では,頻繁に取引信号が発生し,取引コストが増加する可能性があります.
- EMAの交差策は,急速な逆転の状況で遅滞して反応する可能性がある.
- 技術指標に過度に依存すると,基本的な要素の影響を無視する可能性があります.
- 固定 ADX <unk>値は,異なる市場環境で不一致な表現をする可能性があります.
戦略最適化の方向性
- 波動率指標 ((ATRなど) を導入して,ストップ・ストップ・損失レベルを動的に調整する.
- 取引量指標を取引シグナルに追加することを検討する.
- 市場環境の変化に適応するADX<unk>値システムの開発
- 市場情緒の指標を追加して入場時刻の正確さを向上させる.
- 複数のタイムフレームの周期選択を最適化して,最適な組み合わせを探します.
要約する
この戦略は,多次元的な技術分析方法と厳格なリスク制御により,取引の良き潜在性を示しています.反測では安定したパフォーマンスを示していますが,実際の環境で充分な検証が必要です.戦略のモジュール化設計により,強力な適応性と最適化スペースがあり,市場の変化に応じて柔軟に調整できます.
Source
Pine
Strategy parameters
Related strategies
Comment
All comments (0)
No data
- 1