
2
Follow
478
Followers
概要
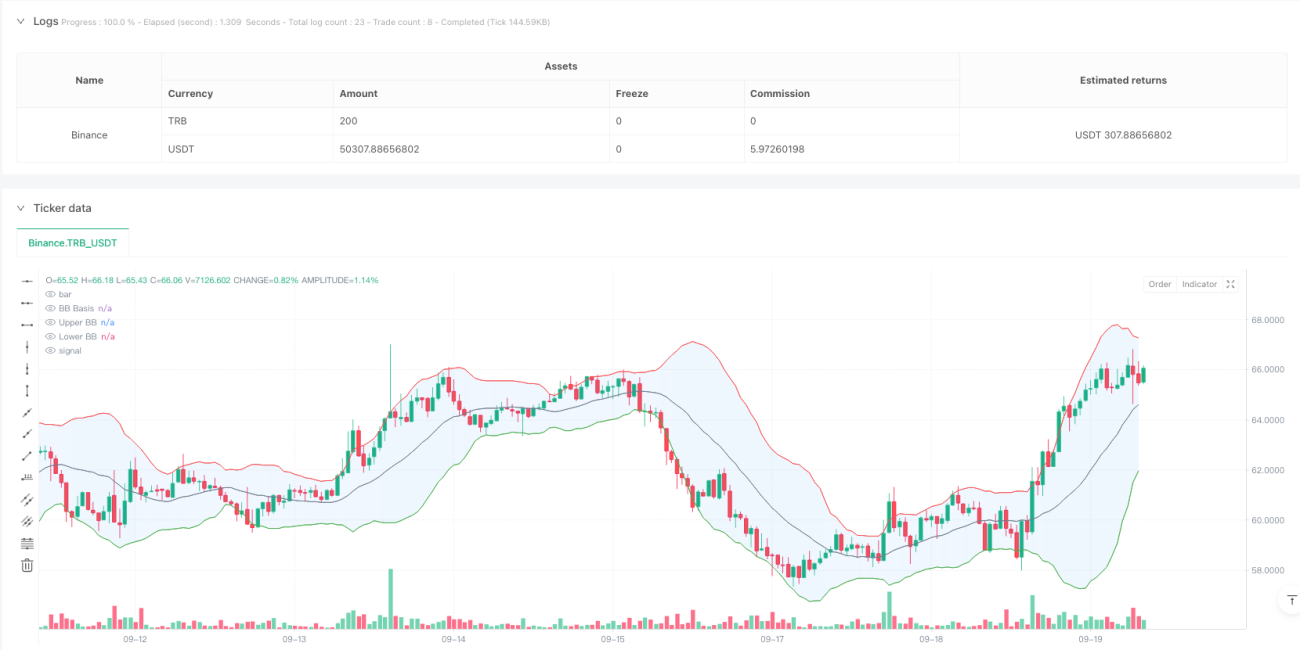
これは,ブリン帯 ((Bollinger Bands),移動平均分散 ((MACD) と取引量分析を組み合わせた高周波取引戦略システムである. この戦略は,ブリン帯で価格が下落する突破と逆転を識別し,MACDの動量指標と取引量確認を組み合わせて,市場の逆転の機会を捉えるために使用される. システムは,最大取引回数制限を設定し,完全なリスク管理機構を備えている.
戦略原則
戦略は主に以下の3つのコア指標の組み合わせに基づいています.
- ブリン帯指数: 20周期のシンプル・ムービング・アベア ((SMA)) を中軌道として用いて,標準差の倍数2.0で上下軌道計算する.価格がブリン帯を突破した後に戻るとき,システムは潜在的取引信号を発する.
- MACD指標:標準パラメータ設定 ((12,26,9) を採用し,価格トレンドの動力を確認する. MACD線が信号線上にあるときは多信号を確認し,信号線下にある時は空信号を確認する.
- 取引量分析:20周期移動平均を使用して取引量を確認し,信号が現れる時に取引量が少なくとも平均レベルに達することを要求し,市場参加度を確保する.
戦略的優位性
- 多重シグナル確認: ブリン帯,MACD,取引量3重検証により,取引シグナルの信頼性が著しく向上した.
- ビジュアルデザイン: システムには,ブリン帯の埋め込み,シグナルマーク,背景の色の変化を含む豊富なグラフ指示が提供され,トレーダーが取引機会を迅速に識別することを容易にします.
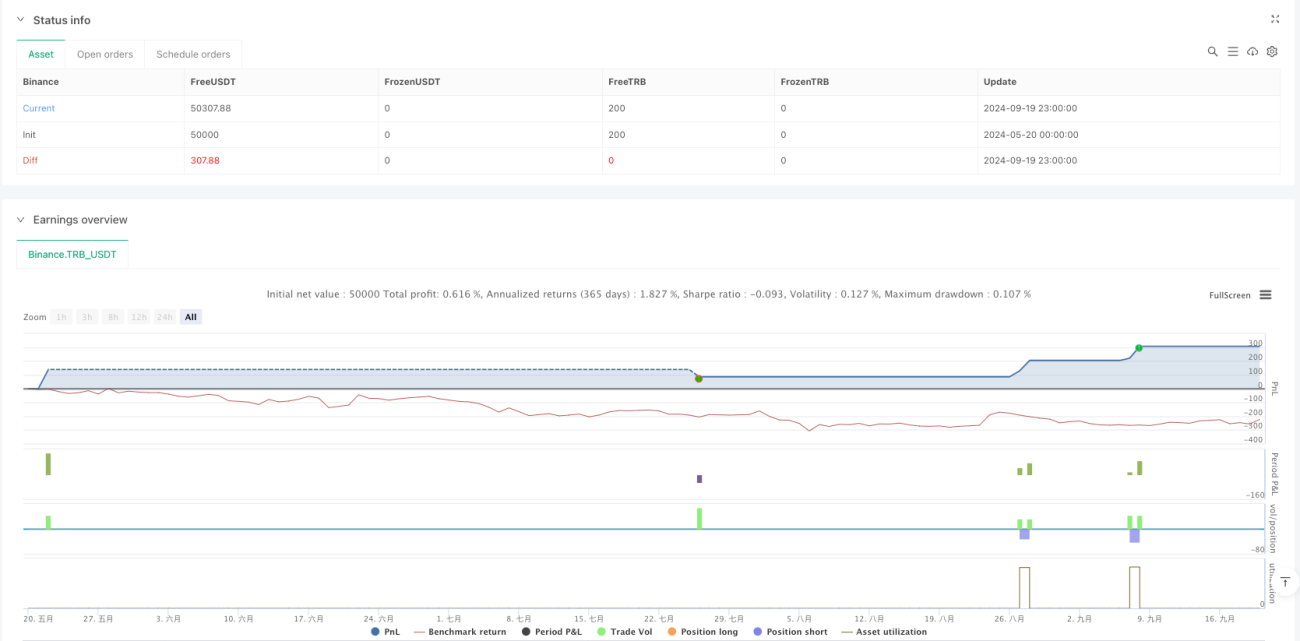
- リスク管理が完ぺき:固定ストップ・ロズとリターン・ゴールを導入し,最大1日の取引数を制限し,リスクの<unk>を効果的に制御する.
- システム化された操作: 戦略は,入場と出場の条件を明確に提供し,主観的な判断による不確実性を軽減します.
戦略リスク
- 市場変動のリスク:高波動の市場では,偽の突破シグナルが発生し,取引の損失を引き起こす可能性があります.
- スリップポイントリスク:高周波取引環境では,実際の利益に影響を与える大きなスリップポイントコストに直面する可能性があります.
- 流動性のリスク:取引量条件は,市場の流動性が不足しているときに取引の機会を制限する可能性があります.
- システムリスク: 固定パラメータの設定は,市場条件の急激な変化に適応できない可能性があります.
戦略最適化の方向性
- パラメータの動的最適化: 適応的パラメータ調整機構を導入し,ブリン帯とMACDパラメータを市場条件に応じて自動的に調整することができる.
- 市場周期認識:市場周期判断モジュールを追加し,異なる市場周期で異なる取引戦略を採用する.
- リスク管理の最適化: 市場変動に応じてストップポジションを調整するダイナミックストップメカニズムを導入することを検討する.
- 信号フィルタ強化:トレンド強度フィルターを追加し,横軸市場で過剰な取引信号を生じさせないようにする.
要約する
この戦略は,ブリン帯反転信号,MACDトレンド確認,取引量検証の組み合わせによって,完全な取引システムを構築している.システムの視覚的な設計と厳格なリスク管理は,一日の取引に特に適している.一定の市場リスクがあるものの,継続的な最適化とパラメータ調整により,戦略は,異なる市場環境で安定したパフォーマンスを維持する見込みである.
Source
Pine
Strategy parameters
Related strategies
Comment
All comments (0)
No data
- 1