概要
この戦略は,技術分析に基づく総合的な取引システムで,サポート・レジスタンス・ゾーン,図形状,市場構造の分析を組み合わせている.戦略は,重要な価格レベルを識別し,図信号を確認し,全体的な市場動向を評価することによって取引決定を行う.システムは,リスクと利益の1:3の比率を採用し,預設の止損と利益の目標によってリスクを管理する.
戦略原則
戦略の核心的な論理は,以下の重要な要素に基づいています.
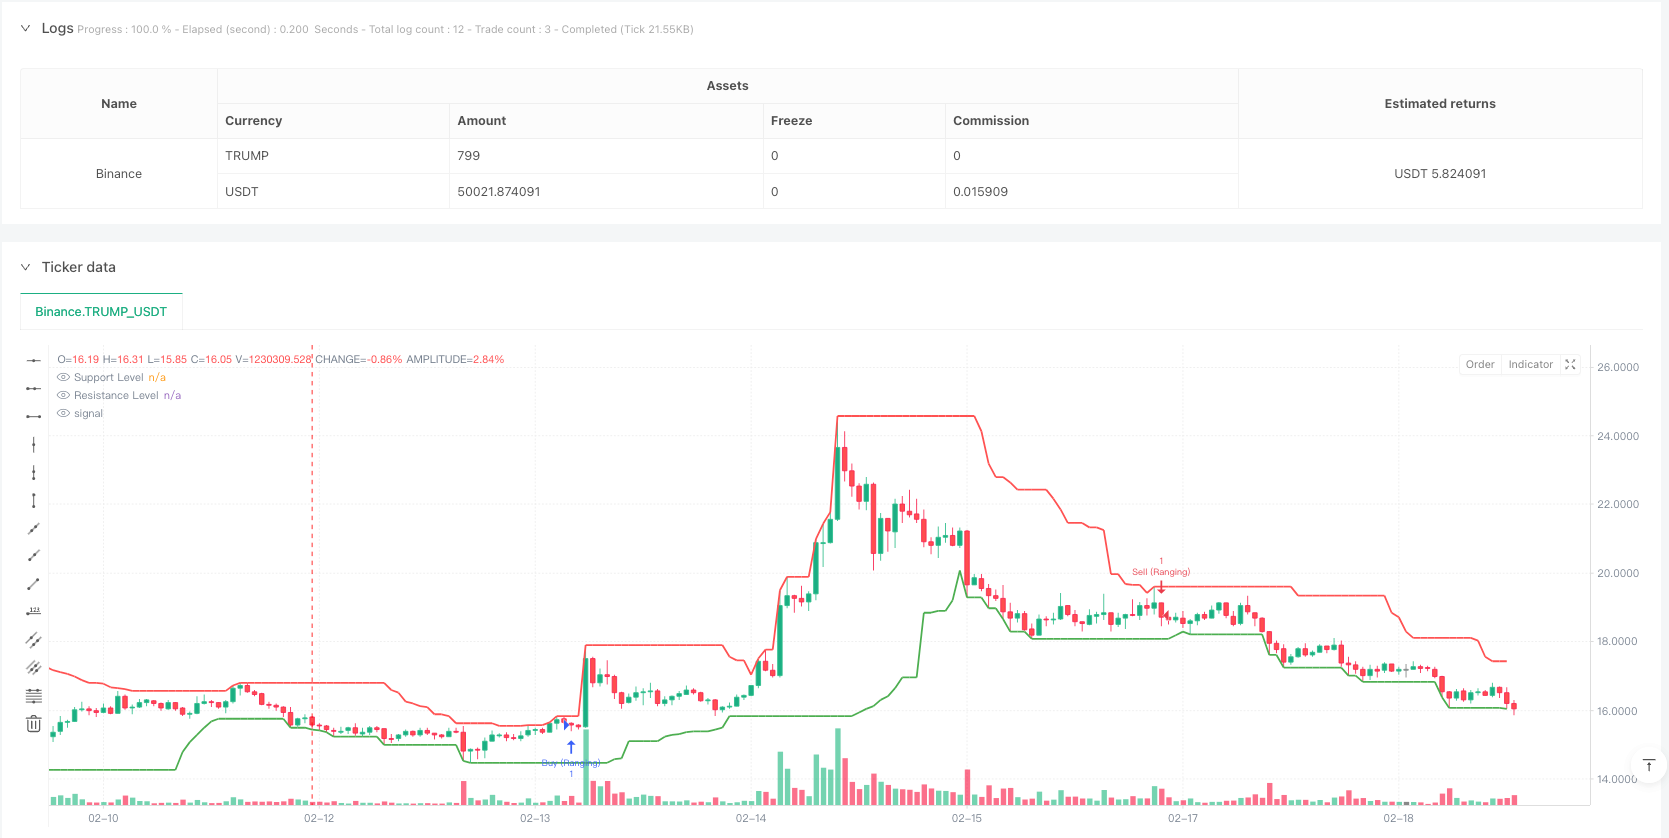
- サポート・レジスタンス・エリアの識別 - 過去20サイクルにおける最高値と最低値を使用して,重要な価格レベルを決定する
- 図形確認 - 呑み,呑み,子線,流星線などの典型的な形
- 市場構造分析 - 高点と低点の連続を比較して,市場が上昇傾向,下降傾向,または区間振動にあるかを判断する
- リスク管理 - 固定ストップポイントと1:3のリスク/利益比でストップポジションを設定する
戦略は,トレンド市場,区間市場,およびターニング市場という3種類の市場環境で動作しますが,それぞれの環境には異なる取引規則の組み合わせが適用されます.
戦略的優位性
- 多次元分析 - 価格レベル,グラフ形状,市場構造を統合することで,より信頼性の高い取引シグナルを提供する
- 適応力 - 傾向や区間を含む異なる市場環境に適応する能力
- 優れたリスク管理 - 固定的リスク/利益比率で,取引ごとに明確なリスク管理を確保する
- ビジュアルサポート - グラフィックマークで抵抗領域を支える,トレーダーが市場の状態を理解できるように
戦略リスク
- 偽の突破リスク - 価格が突破後,偽のシグナルを生じ,迅速に後退する可能性がある
- 滑落リスク - 変動が激しい時期には,実際の取引価格が予想より大きく偏る可能性があります
- パラメータの感受性 - 抵抗周期,市場構造周期などのパラメータの選択は,戦略のパフォーマンスを大きく影響する
- 市場環境依存性 - 急速な単方向の動きや激しい変動の市場では不良な結果が出る可能性
戦略最適化の方向性
- 動的パラメータ調整 - 市場変動に応じてサポート・レジスタンス領域を自動的に調整する計算周期
- フィルター強化 - 偽突破信号をフィルタリングするために,交差量,波動率などの指標を追加
- ストップ・ロズ・オプティミゼーション - ATR ベースのダイナミック・ストップ・ロズ・設定を実現し,市場の変動への適応性を向上させる
- タイムフレーム検証 - 信号の信頼性を高めるために,複数のタイムフレーム解析を導入する
- ポジション管理の最適化 - 市場の波動性と信号の強さに基づいてポジションの規模を動的に調整する
要約する
この戦略は,複数の技術分析ツールの統合的な使用によって,完全な取引システムを構築している.その優点は,多次元分析と完全なリスク管理にあるが,同時に,偽の突破やパラメータの感受性などの課題に直面している.提案された最適化の方向によって,戦略は,既存の優位性の維持に基づいて,安定性と適応性をさらに向上させる見通しがある.この戦略をうまく適用するには,トレーダーは各構成要素を深く理解し,実際の市場状況に応じて適切なパラメータの調整を行う必要がある.
ストラテジーソースコード
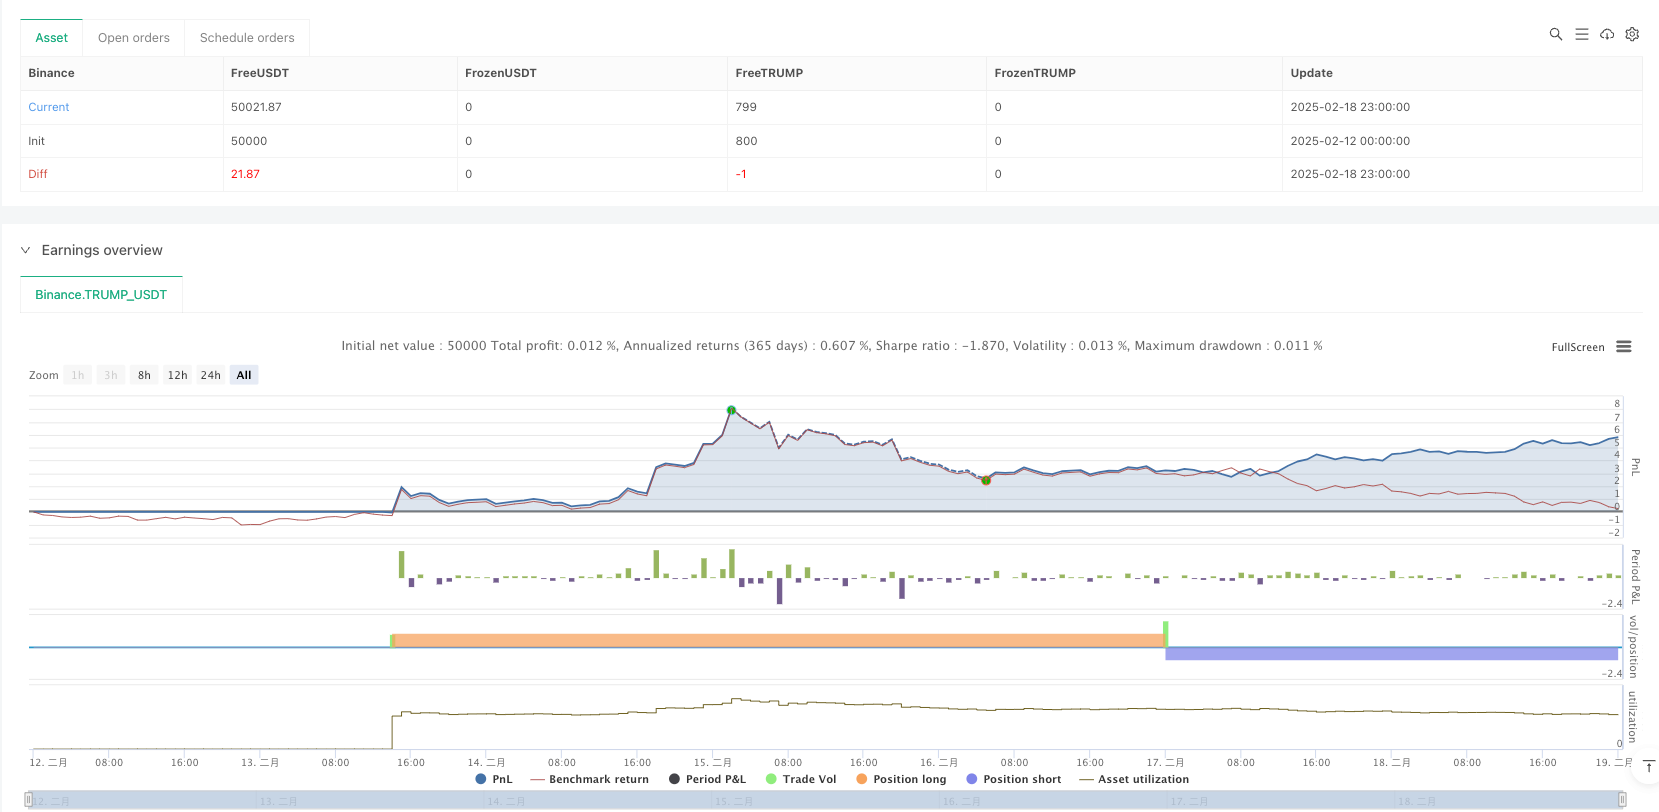
/*backtest
start: 2025-02-12 00:00:00
end: 2025-02-19 00:00:00
period: 1h
basePeriod: 1h
exchanges: [{"eid":"Binance","currency":"TRUMP_USDT"}]
*/

//@version=5
strategy("Support/Resistance Strategy with Candlestick Confirmation, Market Structure, and 1:3 R:R", overlay=true)

// Input parameters
supportResistancePeriod = input.int(20, title="Support/Resistance Period", minval=1)
stopLossPips = input.int(50, title="Stop Loss (in pips)", minval=1)
takeProfitRatio = input.float(3.0, title="Risk-to-Reward Ratio", minval=1.0)
structurePeriod = input.int(20, title="Market Structure Period", minval=1)  // Period to determine market structure

// Function to calculate support level (lowest low in the period)
getSupportLevel() =>
    ta.lowest(low, supportResistancePeriod)

// Function to calculate resistance level (highest high in the period)
getResistanceLevel() =>
    ta.highest(high, supportResistancePeriod)

// Get the support and resistance levels
supportLevel = getSupportLevel()
resistanceLevel = getResistanceLevel()

// Function to detect market structure
isBullishTrend() =>
    high[structurePeriod] > high[structurePeriod+1] and low[structurePeriod] > low[structurePeriod+1]

isBearishTrend() =>
    high[structurePeriod] < high[structurePeriod+1] and low[structurePeriod] < low[structurePeriod+1]

isRanging() =>
    not isBullishTrend() and not isBearishTrend()

// Candlestick Pattern Detection Functions
isBullishEngulfing() =>
    close[1] < open[1] and close > open and close > open[1] and open < close[1]

isBearishEngulfing() =>
    close[1] > open[1] and close < open and close < open[1] and open > close[1]

isDoji() =>
    math.abs(close - open) <= (high - low) * 0.1

isHammer() =>
    body = math.abs(close - open)
    upperShadow = high - math.max(close, open)
    lowerShadow = math.min(close, open) - low
    body <= (high - low) * 0.3 and lowerShadow > body * 2 and upperShadow <= body * 0.5

isShootingStar() =>
    body = math.abs(close - open)
    upperShadow = high - math.max(close, open)
    lowerShadow = math.min(close, open) - low
    body <= (high - low) * 0.3 and upperShadow > body * 2 and lowerShadow <= body * 0.5

// Conditions for Buy and Sell based on candle close
buyCondition = (isBullishEngulfing() or isHammer()) and close > supportLevel
sellCondition = (isBearishEngulfing() or isShootingStar()) and close < resistanceLevel

// Define buy/sell conditions based on market structure
bullishMarket = isBullishTrend() and buyCondition
bearishMarket = isBearishTrend() and sellCondition
rangingMarket = isRanging() and (buyCondition or sellCondition)

// Calculate the Stop Loss and Take Profit Levels
longStopLoss = supportLevel - (stopLossPips * syminfo.mintick)
shortStopLoss = resistanceLevel + (stopLossPips * syminfo.mintick)

// Calculate R:R based Take Profit Levels
longTakeProfit = close + (math.abs(close - longStopLoss) * takeProfitRatio)
shortTakeProfit = close - (math.abs(close - shortStopLoss) * takeProfitRatio)

// Plotting Support and Resistance Lines
plot(supportLevel, color=color.green, linewidth=2, title="Support Level", style=plot.style_line)
plot(resistanceLevel, color=color.red, linewidth=2, title="Resistance Level", style=plot.style_line)

// Strategy: Buy on Support, Sell on Resistance with candlestick confirmation and market structure
if (bullishMarket)
    strategy.entry("Buy", strategy.long, stop=longStopLoss, limit=longTakeProfit)

if (bearishMarket)
    strategy.entry("Sell", strategy.short, stop=shortStopLoss, limit=shortTakeProfit)

if (rangingMarket)
    if (buyCondition)
        strategy.entry("Buy (Ranging)", strategy.long, stop=longStopLoss, limit=longTakeProfit)
    if (sellCondition)
        strategy.entry("Sell (Ranging)", strategy.short, stop=shortStopLoss, limit=shortTakeProfit)

// Optional: Highlighting the zones for support and resistance
bgcolor(close > resistanceLevel ? color.new(color.red, 90) : na, title="Resistance Zone")
bgcolor(close < supportLevel ? color.new(color.green, 90) : na, title="Support Zone")