ガウスチャネルトレンドフォローとストキャスティクスRSI取引戦略

2
Follow
478
Followers
概要
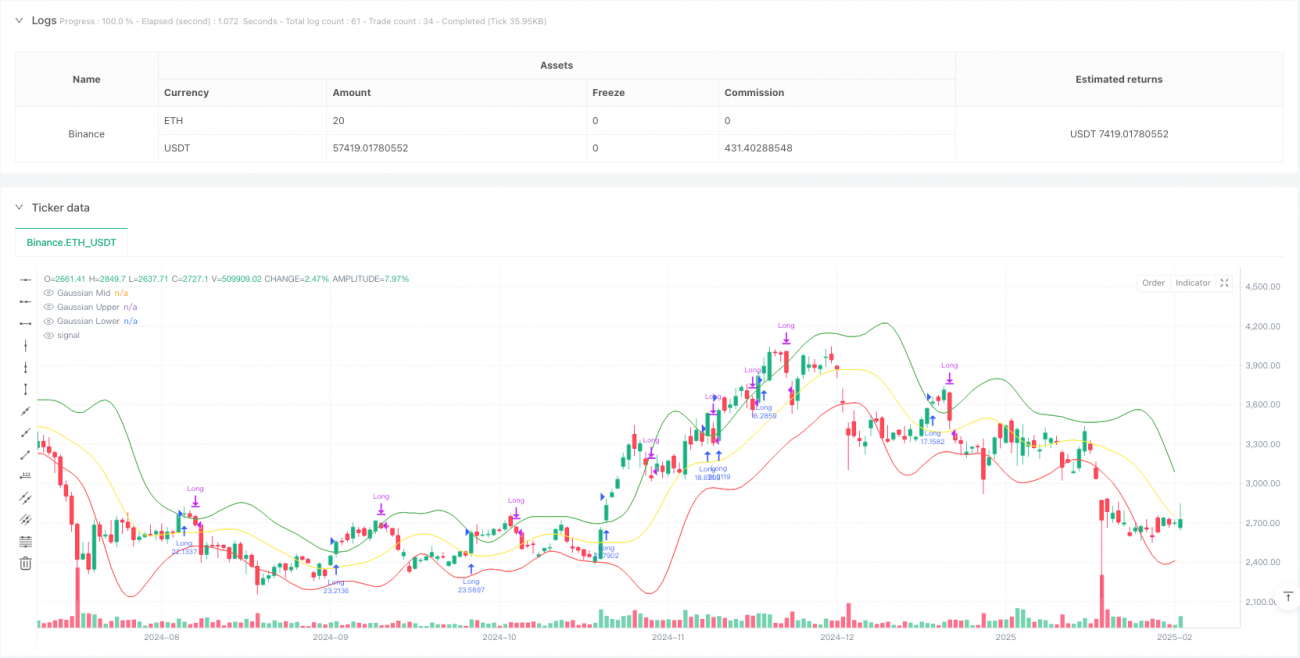
この戦略は,高加減の移動平均チャネルとランダムな相対的に弱い指数 (Stochastic RSI) を組み合わせたトレンド追跡取引システムである.この戦略は高加減の方法によって価格チャネルを構築し,ランダムなRSI指標の交差信号と組み合わせて,入場と出場のタイミングを決定し,トレンドの把握と動力の確認を実現する.この戦略は,優れた数学的な基礎を有し,市場ノイズを効果的にフィルターし,主要なトレンドを捕捉することができる.
戦略原則
戦略の核心的な論理は以下の2つの部分から成り立っています.
-
高斯通道システム:高斯加重移動平均 ((GWMA) と高斯加重標準差 ((GWSD) を使用して価格通道を構築する.GWMAは最近のデータにより大きな重みを与え,均線が価格変化に対する反応をより敏感にする.通道上下はGWSDを倍数因子で掛けることで決定する.
-
ランダムなRSIシステム:従来のRSI指標をランダム化してK値とD値を計算する.この処理は,超買い超売り領域をよりよく識別し,より正確な動力信号を提供します.
取引シグナルの生成は以下の条件に基づいています.
- 多入場:価格の閉盤価格が高斯通路を突破し,ランダムなRSIのK線でD線を突破する
- 平仓シグナル:高松通路の値下げで閉店
戦略的優位性
- 数学的な基礎がしっかりしている:高斯加加重法で価格チャネルを構成し,単純移動平均よりも理論的な基礎が優れている.
- 信号の信頼性: 価格の突破と動力の確認を組み合わせた二重検証の仕組みは,偽信号を効果的に減らすことができます.
- 適応性強:高斯加重法により,市場の変動に応じて通路幅を自動的に調整できる.
- リスク管理の完善: 資金管理と手数料設定により,取引コストとリスクの効果的な管理を実現.
戦略リスク
- トレンド依存性: 波動的な市場では頻繁に偽信号が生み出され,過度な取引が起こりうる.
- 遅延効果:多重平均線平滑を使用しているため,トレンド転換点で信号遅延が発生する可能性があります.
- パラメータ感度: 戦略効果はパラメータ設定によって大きく影響され,各パラメータを注意深く最適化する必要があります.
戦略最適化の方向性
- 市場環境識別:市場環境判断機構を追加し,異なる市場状態で異なるパラメータ設定を使用する.
- ストップ・オプティマイズ:ATRまたは波動率に基づく自律的ストップなどのダイナミック・ストップ・メカニズムを導入する.
- 信号フィルタリング: 取引量確認または他の技術指標を補助的なフィルタリング条件として追加する.
- 資金管理:より柔軟なポジション管理戦略を実現し,信号強度に応じてポジションの割合を動的に調整する.
要約する
この戦略は,ガースチャネルとランダムなRSI指標を組み合わせて,堅牢な数学的な基礎を持つトレンド追跡システムを構築している.戦略は,傾向が顕著な市場で優れているが,パラメータの最適化と市場環境の適応性には注意が必要である.推奨された最適化措置を実行することによって,戦略の安定性と収益性をさらに向上させることができる.
Source
Pine
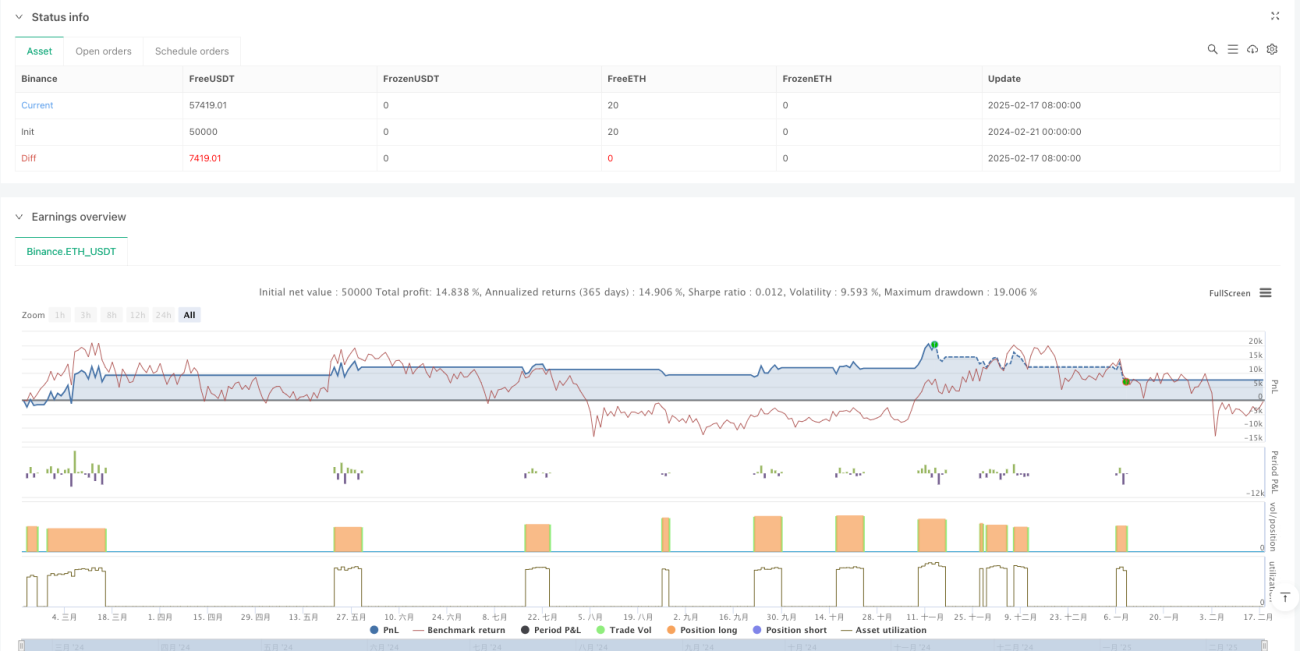
/*backtest
start: 2024-02-21 00:00:00
end: 2025-02-18 08:00:00
period: 1d
basePeriod: 1d
exchanges: [{"eid":"Binance","currency":"ETH_USDT"}]
*/

//@version=5
strategy("Gaussian Channel + Stoch RSI Strategy", overlay=true, margin_long=100, margin_short=100, initial_capital=100000, commission_type=strategy.commission.percent, commission_value=0.1, default_qty_type=strategy.percent_of_equity, default_qty_value=100, pyramiding=1)

// User InputsStrategy parameters
Related strategies
Comment
All comments (0)
No data
- 1