
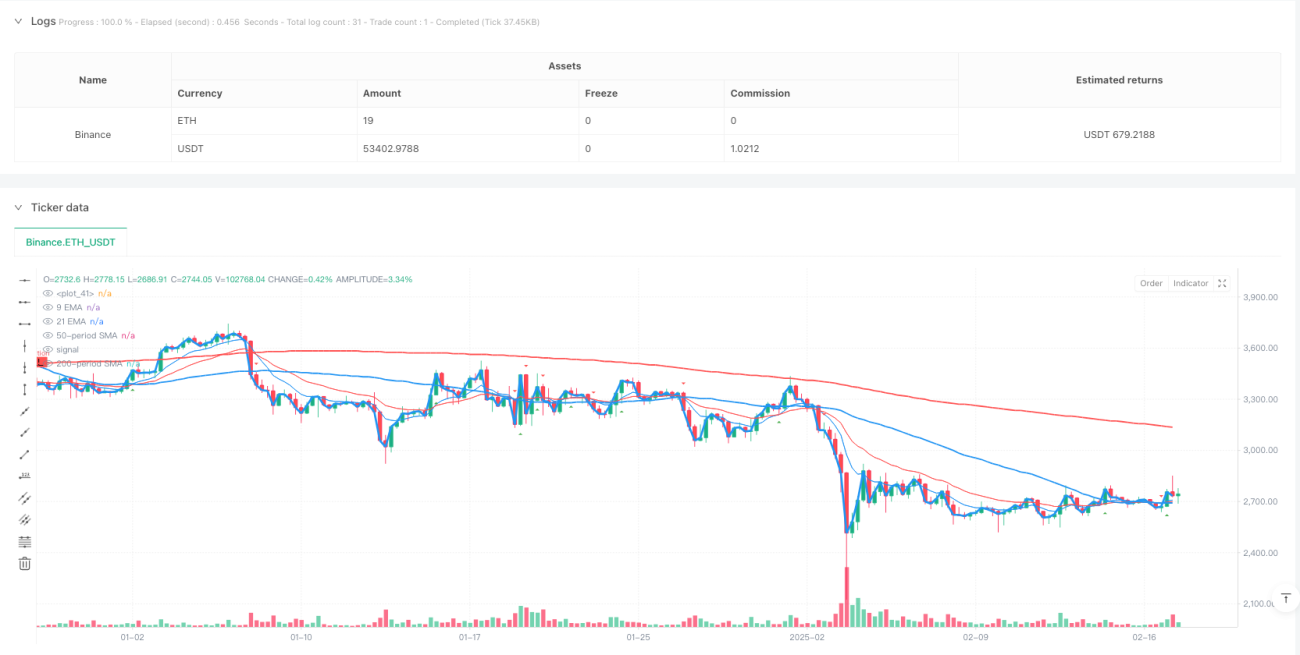
この戦略は,多重平均線組合せに基づくトレンド反転取引システムで,9周期,21周期,50周期,および200周期の移動平均を組み合わせて,平均線交差信号を識別して市場のトレンドの転換点を捕捉します.この戦略は,短期および長期平均線の利点を統合し,市場動向の変化をタイムリーに捕捉え,偽の信号を効果的にフィルターします.
戦略の核心的な論理は,複数の時間枠の均線交差システムに基づいています.具体的には:
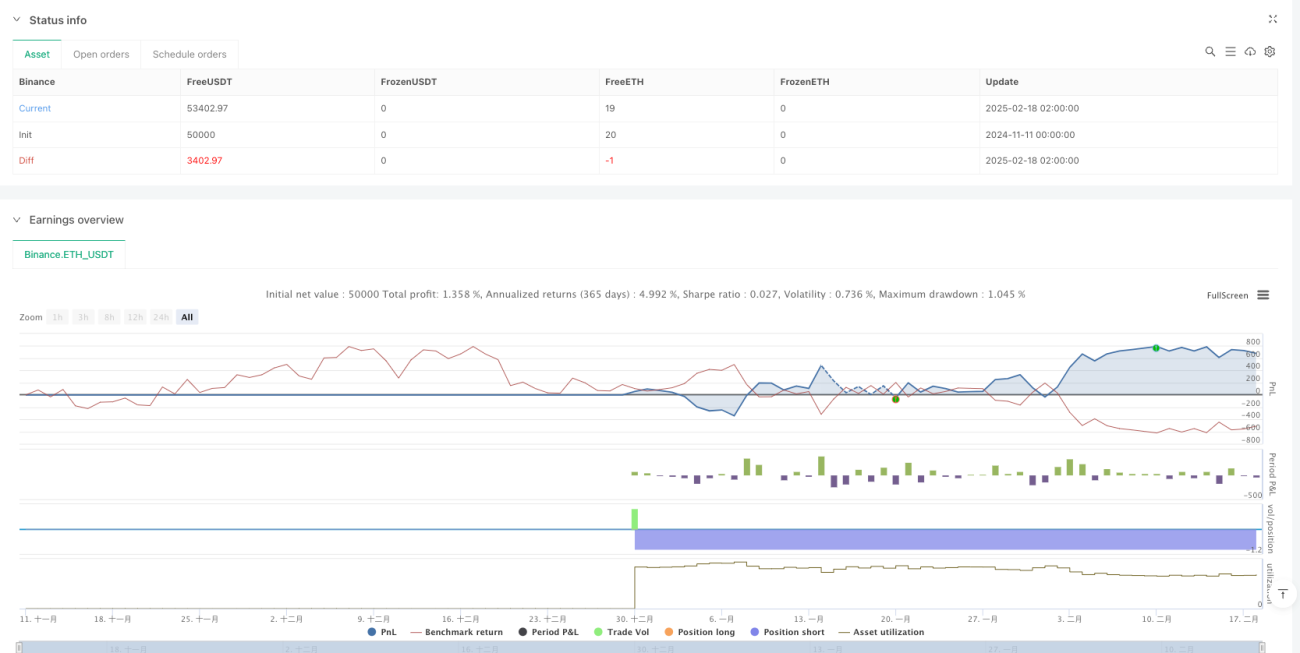
この戦略は,多重均線システムの協同作用により,市場トレンドの転換点の有効な識別を実現している.戦略の設計は,実用性と操作性に焦点を当て,パラメータの柔軟な調整により,異なる市場環境に適応することができる.一定の限界があるものの,継続的な最適化と完善により,戦略の全体的なパフォーマンスは,優れた発展の可能性を持っています.
/*backtest
start: 2024-11-11 00:00:00
end: 2025-02-18 08:00:00
period: 6h
basePeriod: 6h
exchanges: [{"eid":"Binance","currency":"ETH_USDT"}]
*/
//@version=6
//indicator("9/21 EMA Support & Resistance By DSW", overlay=true)
//indicator("Thick and Colorful Line", overlay=true)
// Define the price data
price = close
//@version=6
strategy("9/21/50/200 By DSW Trend Reversal for Options", overlay=true)
// Define the moving averages
short_term_sma = ta.sma(close, 50) // 50-period SMA
long_term_sma = ta.sma(close, 200) // 200-period SMA
// Plot the moving averages
plot(short_term_sma, color=color.blue, linewidth=2, title="50-period SMA")
plot(long_term_sma, color=color.red, linewidth=2, title="200-period SMA")
// Detect crossovers
bullish_reversal = ta.crossover(short_term_sma, long_term_sma) // Short-term SMA crosses above long-term SMA
bearish_reversal = ta.crossunder(short_term_sma, long_term_sma) // Short-term SMA crosses below long-term SMA
// Plot signals on the chart
plotshape(bullish_reversal, title="Bullish Reversal", location=location.belowbar, color=color.green, style=shape.labelup, text="BUY")
plotshape(bearish_reversal, title="Bearish Reversal", location=location.abovebar, color=color.red, style=shape.labeldown, text="SELL")
// Strategy to buy or sell based on the crossovers
if bullish_reversal
strategy.entry("Buy Option", strategy.long) // Buy Call for a bullish reversal
if bearish_reversal
strategy.entry("Sell Option", strategy.short) // Buy Put for a bearish reversal
// Define the color and line thickness
line_color = color.new(color.blue, 0) // You can change this to any color you like
line_width = 3 // This controls the thickness of the line
// Plot the line
plot(price, color=line_color, linewidth=line_width)
// Input parameters
lookback = input.int(10, "Lookback Period")
threshold = input.float(0.5, "Threshold", minval=0, maxval=100, step=0.1)
// Calculate EMAs
ema9 = ta.ema(close, 9)
ema21 = ta.ema(close, 21)
// Plot EMAs
plot(ema9, color=color.blue, title="9 EMA")
plot(ema21, color=color.red, title="21 EMA")
// Function to find pivot highs and lows
pivotHigh = ta.pivothigh(high, lookback, lookback)
pivotLow = ta.pivotlow(low, lookback, lookback)
// EMA Crossover
crossover = ta.crossover(ema9, ema21)
crossunder = ta.crossunder(ema9, ema21)
// Plot crossover signals
plotshape(crossover, title="Bullish Crossover", location=location.belowbar, color=color.green, style=shape.triangleup, size=size.small)
// Plot bearish crossover signals
plotshape(crossunder, title="Bearish Crossover", location=location.abovebar, color=color.red, style=shape.triangledown, size=size.small)
// Alert conditions
if crossover
alert("Bullish EMA Crossover", alert.freq_once_per_bar)
if crossunder
alert("Bearish EMA Crossover", alert.freq_once_per_bar)