二重移動平均トレンドクロスオーバー定量取引戦略の研究と最適化

2
Follow
478
Followers
概要
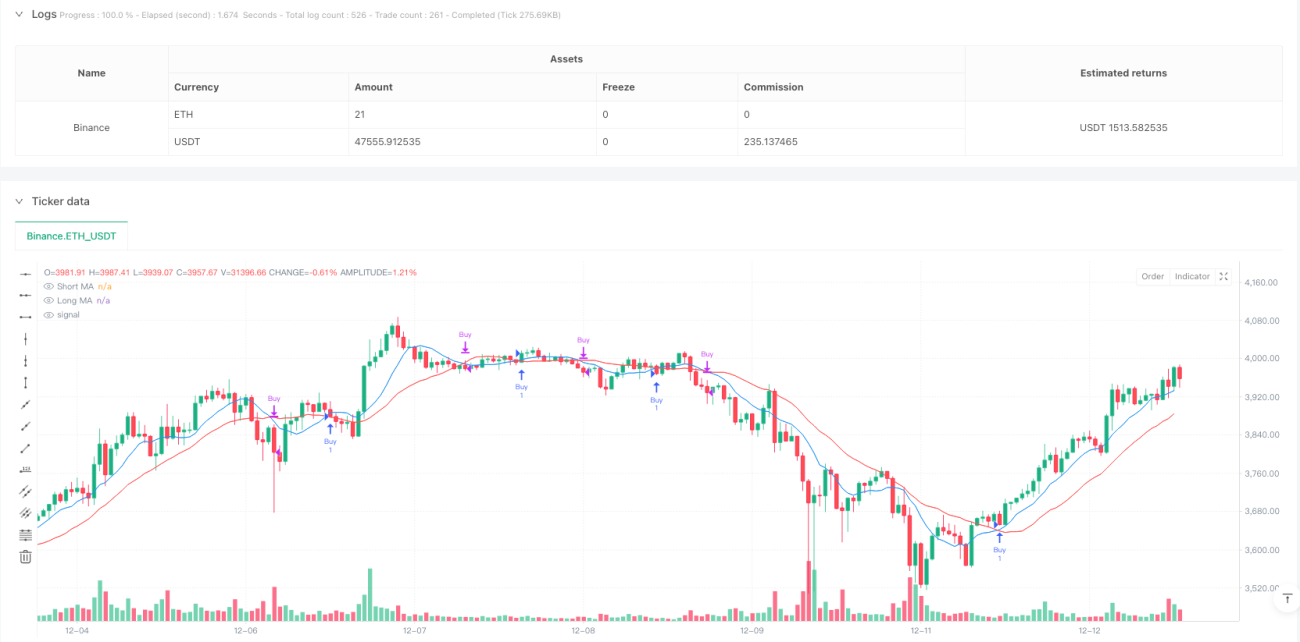
この戦略は,二均線交差に基づくトレンド追跡取引システムである.短期と長期の移動平均 (それぞれ9日と21日) の相対的な位置関係を比較することによって,市場のトレンドの転換のタイミングを捉える.この戦略は,古典的な技術分析理論を採用し,近代的な量的な取引方法と組み合わせて,完全に自動化された取引意思決定プロセスを実現する.
戦略原則
戦略の核心論理は,2つの異なる周期の移動平均の交差信号に基づいています.短期平均線 (第9日) が上向きに長期平均線 (第21日) を渡るとき,システムは市場の動力が上向きに転じ,複数の信号を触発します.短期平均線が下向きに長期平均線 (第21日) を渡るとき,システムは市場の動力が下向きに転じ,平仓で取引を終了します.また,戦略には,取引統計機能が含まれています.
戦略的優位性
- 論理はシンプルで明快で,理解し,維持しやすい.
- 価格データだけで,他の複雑な指標を必要としません.
- 自動トレンド追跡機能で,中長期のトレンドを効果的に捉えます.
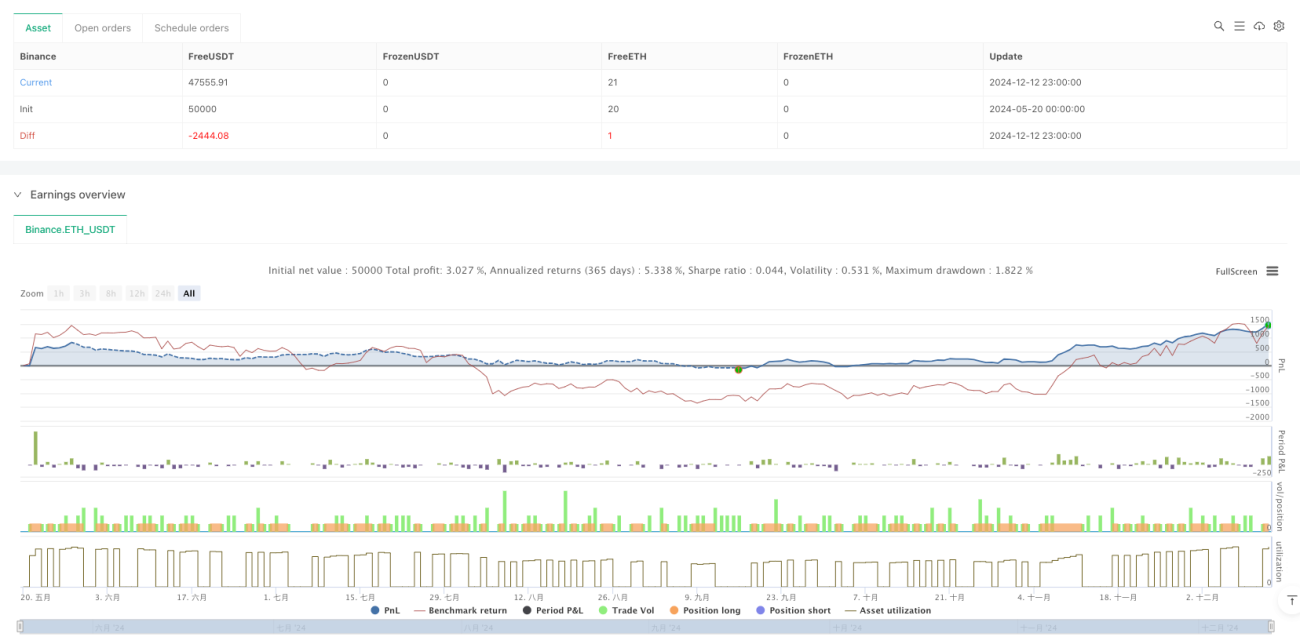
- 戦略的評価のための完全な取引統計システム
- 全自動化により,人間の介入による感情的影響が減る
戦略リスク
- 市場が揺れ動いていると,偽信号が頻繁に発生する可能性があります.
- 入場と出場のタイミングが少し遅れている
- ストップ・メカニズムが設定されていないため,急激な変動で大きな損失を負う可能性があります.
- 市場分析の多面性がないこと
- パラメータが固定され,異なる市場環境に適応するのは難しい
戦略最適化の方向性
- 市場環境への戦略の適応性を向上させるための自己適応平均線サイクル導入
- 波動率のフィルターを増やして,波動市場の偽信号を減らす
- ダイナミック・ストップ・メカニズムを設計し,下落のリスクを制御する
- RSIやMACDなどの他の技術指標と組み合わせて,信号の信頼性を向上させる
- 市場環境認識モジュールを開発し,インテリジェントパラメータ調整を実現
要約する
これは,二均線交差による市場動力の変化を捕捉する,古典的で実用的トレンド追跡戦略である.ある程度の遅滞と偽信号のリスクがあるにもかかわらず,そのシンプルで安定した特性は,量化取引の分野で重要なツールにしています.提案された最適化方向によって,戦略の安定性と収益性がさらに向上する見込みがあります.
Source
Pine
Related strategies
Comment
All comments (0)
No data
- 1