SRSIとMACDのインテリジェントリスク管理システムと組み合わせた動的適応型マルチインジケータークロスオーバー戦略

2
Follow
478
Followers
概要
この戦略は,ランダムな比較的弱い指標 ((SRSI) と移動平均トレンド/分散指標 ((MACD) を組み合わせたダイナミックな取引システムである.ATR指標を動的に調整することで,ストップとストップポイントの位置を調整し,リスクのインテリジェントな管理を実現する.この戦略の核心は,複数の技術指標の交叉確認によって取引信号を生成し,同時に市場の変動を組み合わせてポジション管理を行うことである.
戦略原則
戦略は以下の核心的なメカニズムに基づいています.
- 市場動向を判断するには,SRSIのK線とD線の差,およびK線と統一MACDの差を計算します.
- 購入条件は同時に満たされる:K-D差は正,K-MACD差は正,MACDは下落傾向ではない
- 売却条件は同時に満たされる:K-D差は負であり,K-MACD差は負であり,MACDは上昇傾向ではない
- ATRをリスク係数で動的に計算し,市場の変動に応じて自律的に調整するストープとストップ距離
戦略的優位性
- 多重シグナル認証メカニズムにより,取引の信頼性が著しく向上し,単一の指標によってもたらされる偽のシグナルを回避します.
- ダイナミックなストップ・ストップの設定は,市場の変動に応じて自動的に調整され,よりよいリスク/利益の比率を提供します.
- 戦略は,異なる市場環境で安定したパフォーマンスを維持するための優れた適応性を持っています
- パラメータは調整可能で,個人リスクの好みに合わせて最適化できます.
戦略リスク
- 波動的な市場で過剰な取引シグナルが生み出され,頻繁に市場から外れる.
- 複数の指標を使用すると,迅速に変化する市場での最適な入場時間を逃す可能性のある信号の遅れ
- ATRは,過去変動率に基づいて計算され,市場の変動率の変化に適時に対応できない可能性があります.
- リスク係数を合理的に設定する必要があります. 大きすぎても小さすぎても,戦略の効果に影響を及ぼす可能性があります.
戦略最適化の方向性
- トレンドフィルターを追加し,振動市場とトレンド市場で異なる信号確認基準を採用
- 信号の信頼性を高めるために,補佐的な確認として交差量指標を導入
- 止損ストップの最適化計算方法,支柱抵抗位と組み合わせて検討できる
- 市場波動率予測モデルに追加し,リスクパラメータを事前に調整する
- 戦略の安定性を高めるために,異なる時間周期で信号確認を検討する.
要約する
この戦略は,SRSIとMACDの優位性を組み合わせて,堅牢な取引システムを構築している.ダイナミックなリスク管理機構は,その適性性を良好に保っているが,実際の市場状況に応じて,トレーダーがパラメータを最適化することが必要である.戦略の成功した運用には,市場の深い理解が必要であり,個人のリスク承受能力と組み合わせて,合理的なポジション管理を行う.
Source
Pine
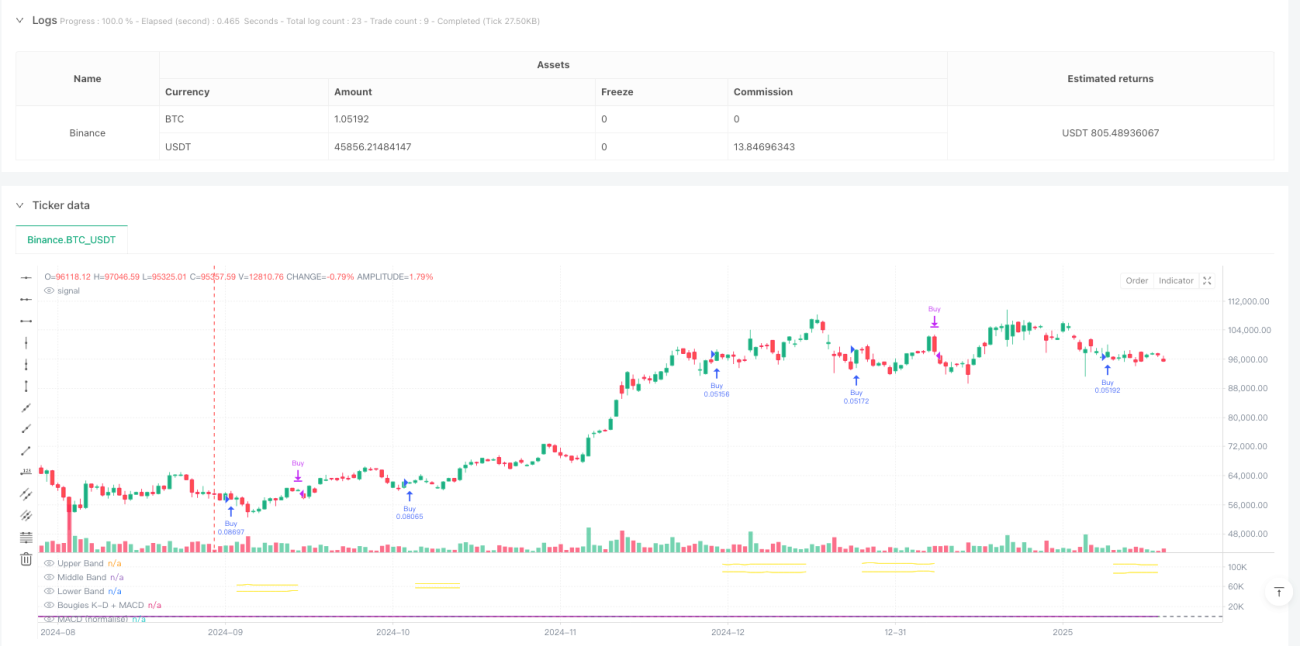
/*backtest
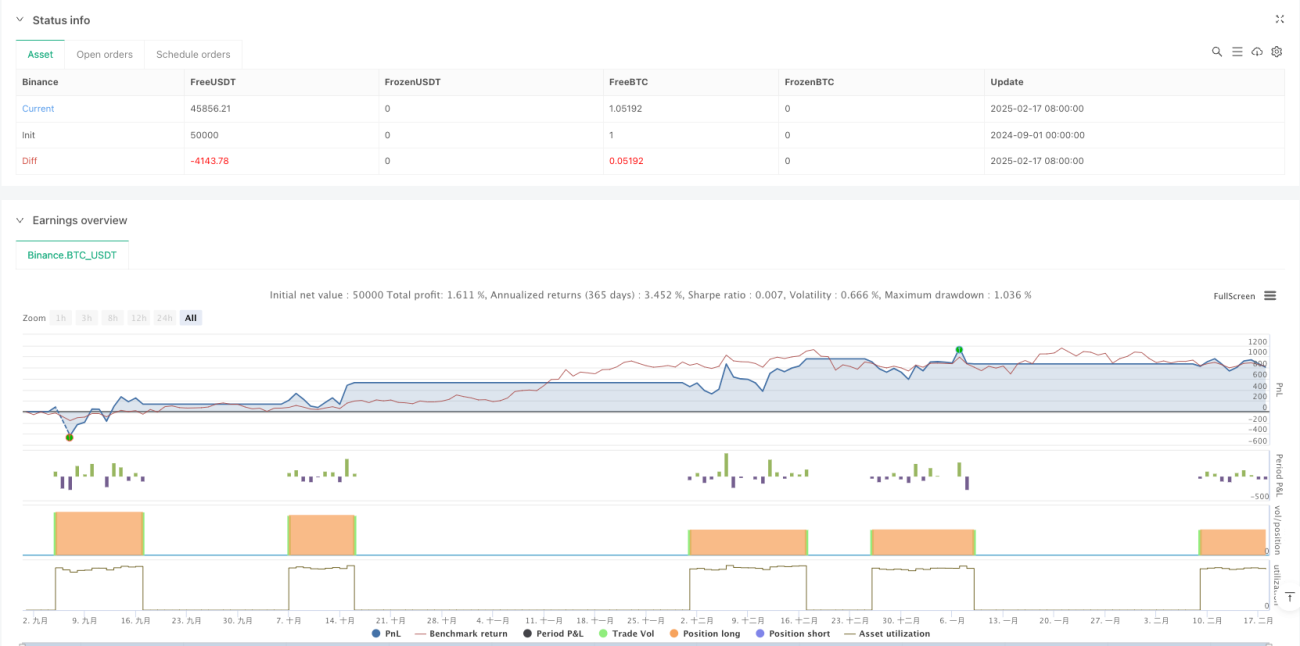
start: 2024-09-01 00:00:00
end: 2025-02-18 08:00:00
period: 1d
basePeriod: 1d
exchanges: [{"eid":"Binance","currency":"BTC_USDT"}]
*/
//@version=6
strategy(title="SRSI + MACD Strategy with Dynamic Stop-Loss and Take-Profit", shorttitle="SRSI + MACD Strategy", overlay=false, default_qty_type=strategy.percent_of_equity, default_qty_value=10)
// User InputsStrategy parameters
Related strategies
Comment
All comments (0)
No data
- 1