動的ATRと二重移動平均クロスオーバーに基づく適応型リスク管理戦略

MA ATR SMA RRR UTC
作成日: 2025-02-20 14:07:26 最終変更日: 2025-02-20 14:07:26
コピー: 1 クリック数: 359
2
フォロー
319
フォロワー

動的ATRと二重移動平均クロスオーバーに基づく適応型リスク管理戦略 動的ATRと二重移動平均クロスオーバーに基づく適応型リスク管理戦略

概要

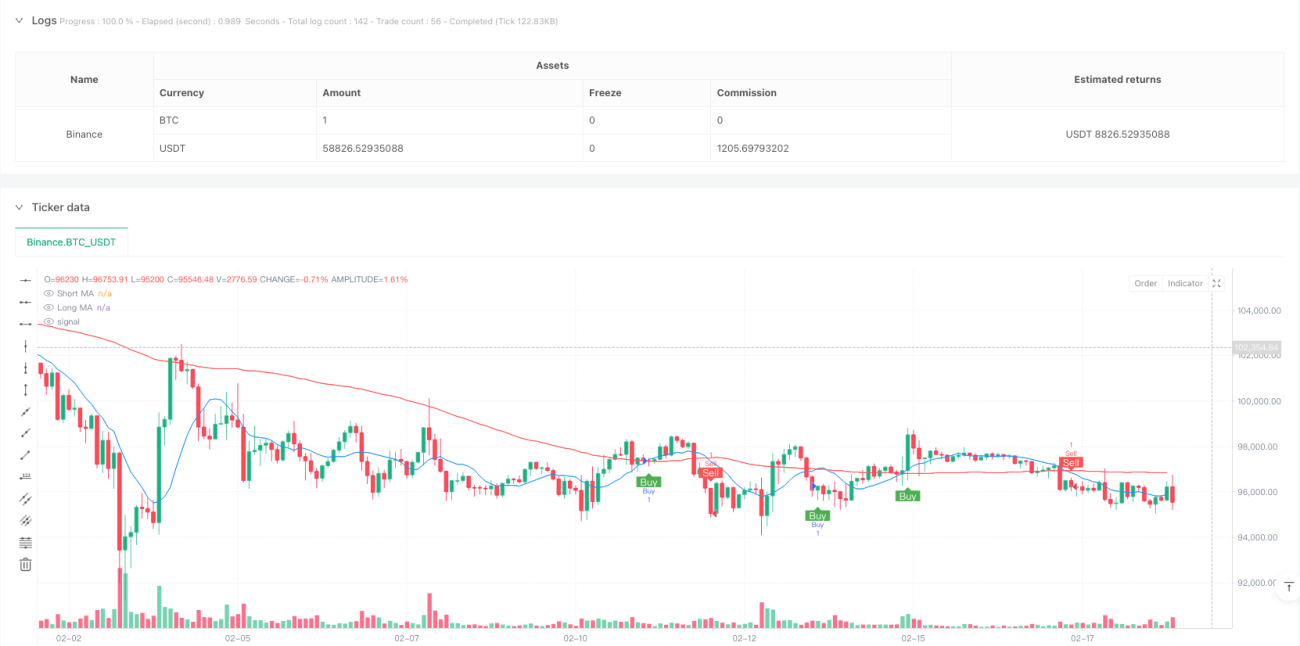
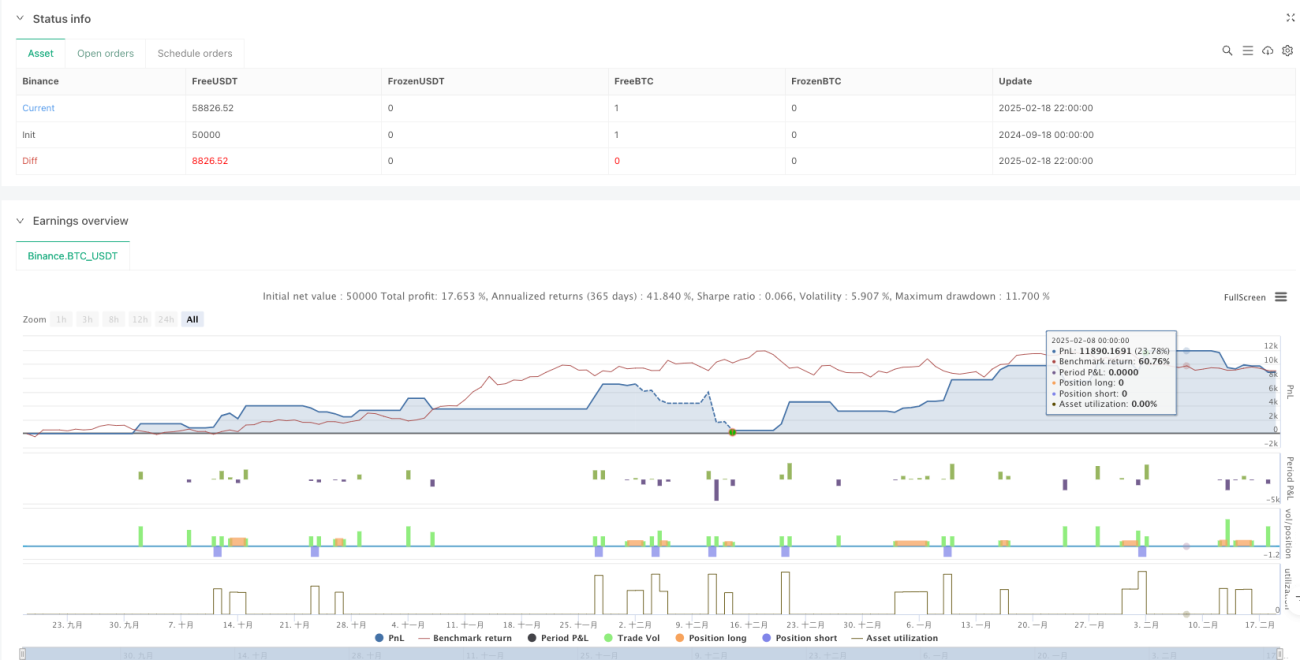
この戦略は,双均線交差信号と動的リスク管理を組み合わせた取引システムである.短期と長期の移動平均の交差によって取引信号を生成し,ATR指標を利用してストップ・ロスを動的に調整し,有利なポジションを獲得し,時間フィルタリングと冷却期を導入して取引品質を最適化する.この戦略には,リスク・リターン・レートと取引あたりのリスクのパーセントの管理機構も含まれている.

戦略原則

この戦略は、次のコアコンポーネントに基づいています。

  1. 信号生成システムは,短期 (“0周期) と長期 (“00周期) の単純な移動平均の交差を用い,取引を誘発する.短期平均線が長期平均線を上向きに横切るときに多行信号が生成され,逆に空白信号が生成される.
  2. リスク管理システムは,14サイクルATRを1.5倍係数で動的止損距離を設定し,利潤目標を止損距離の2倍に設定する.
  3. タイムフィルターは,ユーザが取引の特定の時間帯を設定し,指定された時間帯内でのみ取引を行うことを可能にします.
  4. 取引の冷却期メカニズムは,過剰取引を防ぐために,10サイクルの待ち時間を設定します.
  5. 各取引のリスクは,口座の1%で管理されます (調整可能です).

戦略的優位性

  1. ダイナミックなリスク管理:ATR指標を使用して市場の変動に適応し,異なる市場環境で自動でストップ・ロスと利益の距離を調整する.
  2. 完全なリスク管理: リスクと利益の比率と取引毎のリスクの比率を設定することによって,システム化された資金管理を実現する.
  3. フレキシブルな時間管理:異なる市場の取引時間の特徴に応じて取引時間を調整できます.
  4. 過剰取引防止:冷却期メカニズムは,急激な波動期に過剰取引の信号を発生させないようにします.
  5. 視覚効果:分析と最適化に役立つ取引信号と移動平均をグラフに明確に表示する.

戦略リスク

  1. トレンド反転リスク: 波動的な市場では,偽の突破シグナルが生み出され,連続したストップダウスを引き起こす可能性があります.
  2. 参数感性: 移動平均周期,ATR倍数などの参数選択は,戦略のパフォーマンスに大きく影響する.
  3. タイムフィルターを正しく設定しないと,重要な取引機会が逃れかねない.
  4. 固定リスク/利益の比率は,異なる市場環境で柔軟性がない可能性があります.

戦略最適化の方向性

  1. トレンド強度フィルターを導入します. トレンド強さを判断するためにADXまたは類似の指標を追加し,強いトレンドの間だけ取引します.
  2. 動的に調整されたリスク/利益比率:市場の変動やトレンドの強さに応じて自動的に調整されるリスク/利益比率.
  3. 取引量分析を増やす: 取引量を信号確認の補足指標として使う.
  4. 冷却期間の最適化メカニズム:冷却期間の長さを市場の変動動向に合わせて調整する.
  5. 市場環境の分類に加入:異なる市場環境で異なるパラメータの組み合わせを使用する.

要約する

この戦略は,古典的な技術分析方法と現代的なリスク管理理念を組み合わせて,完全な取引システムを構築している.その核心的な優点は,ダイナミックなリスク管理と複数のフィルタリング機構にあるが,実際のアプリケーションでは,特定の市場の特徴に応じてパラメータの最適化が必要である.戦略の成功運用には,各構成要素の役割を深く理解し,市場変化に応じてパラメータを適時に調整する必要があります.提案された最適化の方向によって,戦略は,異なる市場環境でより安定したパフォーマンスを得る見通しがある.

ストラテジーソースコード
/*backtest
start: 2024-09-18 00:00:00
end: 2025-02-19 00:00:00
period: 2h
basePeriod: 2h
exchanges: [{"eid":"Binance","currency":"BTC_USDT"}]
*/

//@version=5
strategy("Profitable Moving Average Crossover Strategy", shorttitle="Profitable MA Crossover", overlay=true)

// Input parameters for the moving averages
shortPeriod = input.int(10, title="Short Period", minval=1)
longPeriod = input.int(100, title="Long Period", minval=1)

// Input parameters for time filter
startHour = input.int(0, title="Start Hour (UTC)", minval=0, maxval=23)
startMinute = input.int(0, title="Start Minute (UTC)", minval=0, maxval=59)
endHour = input.int(23, title="End Hour (UTC)", minval=0, maxval=23)
endMinute = input.int(59, title="End Minute (UTC)", minval=0, maxval=59)

// Cooldown period input (bars)
cooldownBars = input.int(10, title="Cooldown Period (Bars)", minval=1)

// Risk management inputs
riskRewardRatio = input.float(2, title="Risk-Reward Ratio", minval=1)
riskPercent = input.float(1, title="Risk Per Trade (%)", minval=0.1)

// ATR settings
atrLength = input.int(14, title="ATR Length")
atrMultiplier = input.float(1.5, title="ATR Multiplier for Stop-Loss and Take-Profit")

// Calculate the moving averages
shortMA = ta.sma(close, shortPeriod)
longMA = ta.sma(close, longPeriod)

// Plot the moving averages
plot(shortMA, color=color.blue, title="Short MA")
plot(longMA, color=color.red, title="Long MA")

// Calculate ATR for dynamic stop-loss and take-profit
atr = ta.atr(atrLength)
stopLossOffset = atr * atrMultiplier
takeProfitOffset = stopLossOffset * riskRewardRatio

// Identify the crossover points
bullishCross = ta.crossover(shortMA, longMA)
bearishCross = ta.crossunder(shortMA, longMA)

// Get the current bar's time in UTC
currentTime = na(time("1", "UTC")) ? na : timestamp("UTC", year, month, dayofmonth, hour, minute)

// Define the start and end time in seconds from the start of the day
startTime = timestamp("UTC", year, month, dayofmonth, startHour, startMinute)
endTime = timestamp("UTC", year, month, dayofmonth, endHour, endMinute)

// Check if the current time is within the valid time range
isTimeValid = (currentTime >= startTime) and (currentTime <= endTime)

// Functions to check cooldown
var int lastSignalBar = na
isCooldownActive = (na(lastSignalBar) ? false : (bar_index - lastSignalBar) < cooldownBars)

// Handle buy signals
if (bullishCross and isTimeValid and not isCooldownActive)
    entryPrice = close
    stopLossBuy = entryPrice - stopLossOffset
    takeProfitBuy = entryPrice + takeProfitOffset
    strategy.entry("Buy", strategy.long)
    strategy.exit("TakeProfit/StopLoss", "Buy", stop=stopLossBuy, limit=takeProfitBuy)
    lastSignalBar := bar_index

// Handle sell signals
if (bearishCross and isTimeValid and not isCooldownActive)
    entryPrice = close
    stopLossSell = entryPrice + stopLossOffset
    takeProfitSell = entryPrice - takeProfitOffset
    strategy.entry("Sell", strategy.short)
    strategy.exit("TakeProfit/StopLoss", "Sell", stop=stopLossSell, limit=takeProfitSell)
    lastSignalBar := bar_index

// Plot signals on the chart
plotshape(series=bullishCross and isTimeValid and not isCooldownActive, location=location.belowbar, color=color.green, style=shape.labelup, text="Buy", title="Buy Signal", textcolor=color.white)
plotshape(series=bearishCross and isTimeValid and not isCooldownActive, location=location.abovebar, color=color.red, style=shape.labeldown, text="Sell", title="Sell Signal", textcolor=color.white)

// Strategy performance tracking
strategy.close("Buy", when=not isTimeValid)
strategy.close("Sell", when=not isTimeValid)