
2
Follow
478
Followers
概要
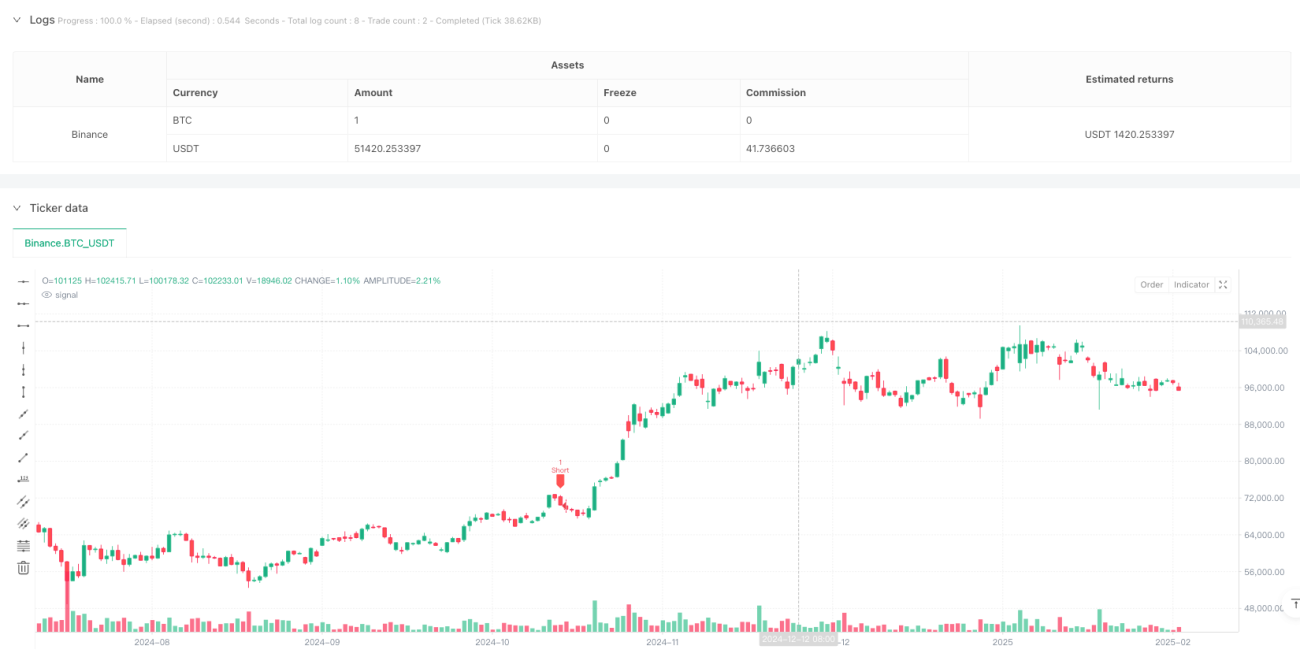
この戦略は,ランダムな指数 (ストキャスティック・オシレータ) に基づく多時間枠波段取引システムである.これは,現在の時間枠とより高い時間枠のランダムな指数信号を組み合わせて取引機会を決定し,ダイナミックなストップ・ロスを使用してリスクを管理する.この戦略は,波動性の高い市場に適用され,価格の短期的な変動を捕捉して利益を得る.
戦略原則
戦略の中核となるロジックは、次の主要な要素に基づいています。
- ランダムな指標を用いて2つの時間枠 (現在のレベルとより高度なレベル) で信号確認
- 超買超売のエリアで交差点を探す
- 購入条件:現在の時間枠K線上でのD線を穿え,K値<20;より高い時間枠K値<20でK>D
- 販売条件:現在の時間枠K線下D線を貫通し,K値>80;より高い時間枠K値>80とK<D
- 入場価格に基づくダイナミックストップストープシステムを使用し,ストープストープの倍数は調整できます
戦略的優位性
- 多時間枠信号の確認により,取引の信頼性が向上し,偽信号を効果的に減少させる.
- 超買い・超売り地域での取引は,トレンドの逆転の可能性を高めています.
- ダイナミックストップ・ストップ・損失システムは,市場の変動に応じて自動的に調整され,資金管理の柔軟性を高めます.
- 交易信号とストップ・ロスの位置を直感的に表示するグラフィック・インターフェースで,トレーダーが理解し操作する
- 戦略のパラメータは,異なる市場環境に対応して調整できます.
戦略リスク
- 激しい波動のある市場において,頻繁にストップダメージが発生する可能性がある状況
- 双重タイムフレームの確認により,いくつかの取引機会が失われる可能性があります.
- 固定倍数のストップ・ストップ・ロスは,すべての市場環境には適さない可能性があります.
- 傾向が強くなると 止まるのは早すぎる
- 利益とリスクのバランスを取るために 合理的なパラメータを設定する必要があります
戦略最適化の方向性
- 市場変動に合わせて動的に調整する適応性ストップ・ローズメカニズムを導入
- トレンドフィルターを追加し,強気なトレンドで取引の方向を調整する
- 取引量指標を補足して確認信号
- よりスマートなポジション管理システム開発
- 市場情緒指標を活用して市場参入のタイミングを最適化
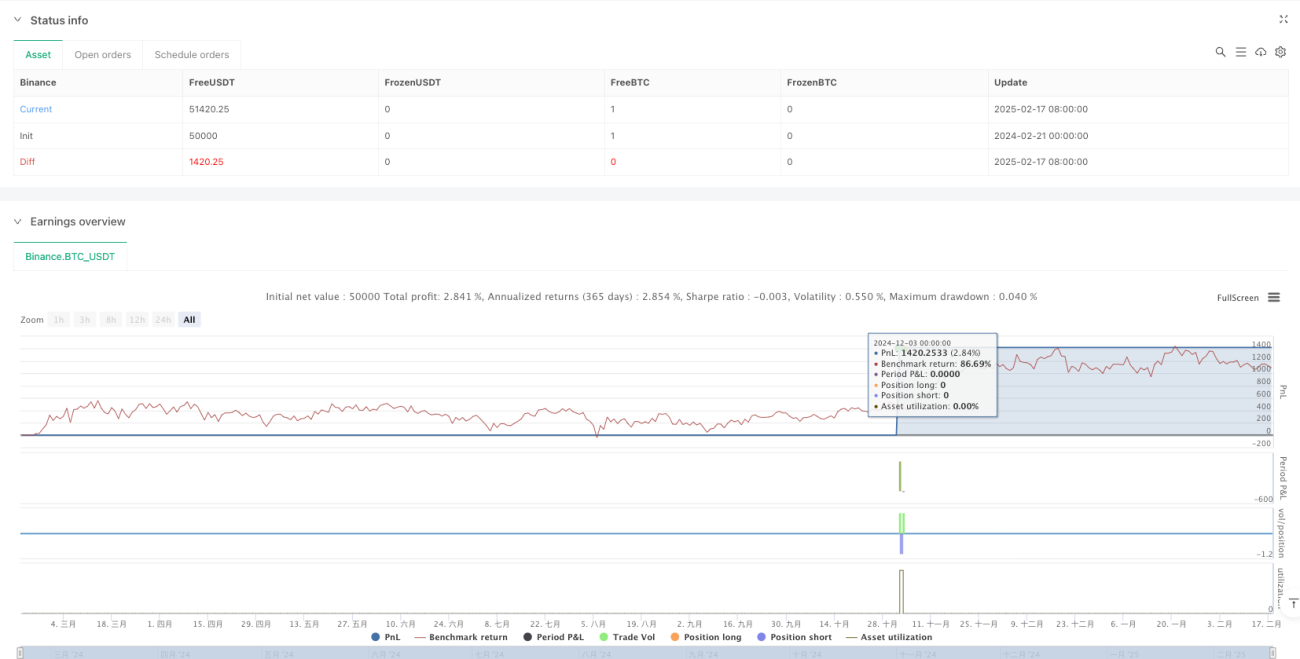
要約する
これは,技術分析とリスク管理を組み合わせた完全な取引システムである. 複数の時間枠の信号確認とダイナミックストップ・ストップにより,戦略は安定性を保ちながらも,優れた利益の潜在能力を有している. しかし,ユーザーは自分の取引スタイルと市場環境に応じてパラメータを最適化し,常に厳格なリスクコントロールを維持する必要があります.
Source
Pine
Strategy parameters
Comment
All comments (0)
No data
- 1