動的適応型マルチタイム期間トレンド追跡およびショック反転複合戦略

ICHIMOKU MACD RSI ATR STOCHASTIC RSI
作成日: 2025-02-20 14:25:14 最終変更日: 2025-02-20 14:48:41
コピー: 0 クリック数: 339
2
フォロー
319
フォロワー

動的適応型マルチタイム期間トレンド追跡およびショック反転複合戦略 動的適応型マルチタイム期間トレンド追跡およびショック反転複合戦略

概要

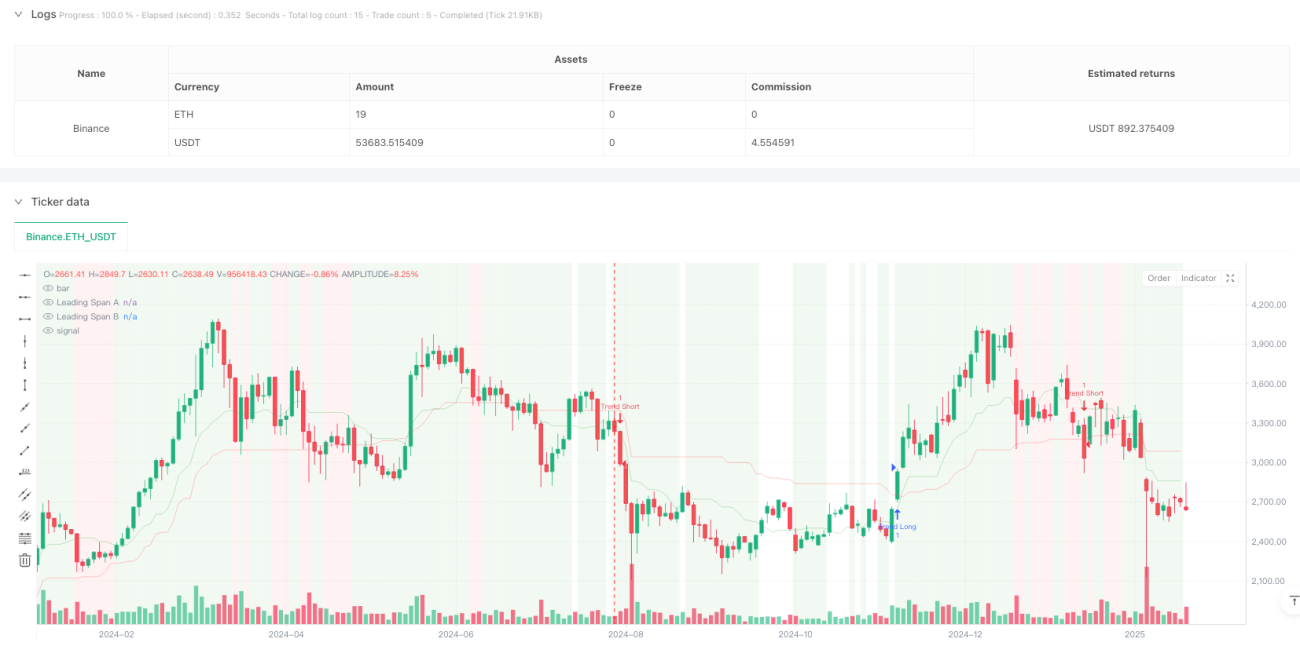
この戦略は,トレンド追跡と区間取引を組み合わせた複合型取引システムで,ichimokuクラウドグラフによる市場状態の識別,MACDの動態確認とRSIの超買い超売り指標を組み合わせ,ATRを動的ストップロズ管理に使用しています.この戦略は,トレンド市場におけるトレンドの機会を捕捉し,揺れ動いている市場における逆転の機会を探し,強い適応性と柔軟性を持っています.

戦略原則

戦略は,複数のレベルの 信号確認メカニズムを使用しています.

  1. 市場状態を判断する主要な根拠として,ichimoku雲図を用いて,価格と雲の位置関係によって市場がトレンド状態か震動状態かを判断する.
  2. トレンド市場では,価格が雲の上にあり,RSI>55でMACD柱状図が正であるとき,入場を多めにします.価格が雲の下にあり,RSI<45でMACD柱状図が負であるとき,入場を空っぽにします
  3. 波動的な市場では,RSI<30でランダムなRSI<20で多額の機会を探し,RSI>70でランダムなRSI>80で空白の機会を探し
  4. ATR ベースの動的ストップを用い,ATR の2倍のストップ距離でリスクを管理する

戦略的優位性

  1. 市場適応性:異なる市場状況に応じて取引戦略を自動的に調整し,戦略の安定性を高める
  2. 信号の信頼性:偽信号の影響を減らすために,複数の指標の検証メカニズムを採用
  3. リスク管理の完善:ATRの動的停止により,利益の充実とリスクの効率的な管理が可能
  4. ビジュアル化効果:背景の色で市場状況をマークし,トレーダーが市場環境を直感的に理解できるようにする
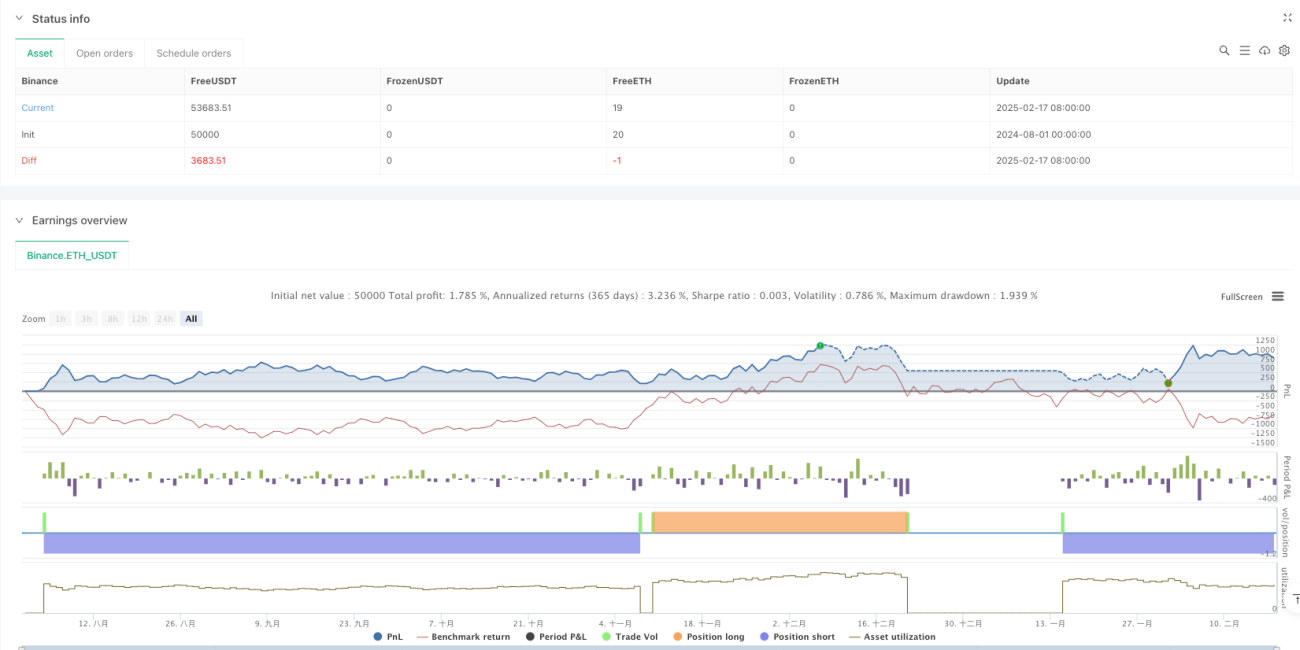
  5. 高タイムサイクルでの優れたパフォーマンス:日線周期で2.159の収益因子で,純利益10.71%に達

戦略リスク

  1. 低勝利率:各タイムサイクルでの勝利率は40%以下で,強い心理的耐性が必要
  2. 低時間周期の過剰取引: 4 時間周期で430 件の取引が実行され,効率が悪かった
  3. 信号遅れ:複数の指標の検証により,市場機会が逃れている可能性
  4. パラメータ最適化は困難:複数の指標の組み合わせにより,戦略最適化の複雑性が増加

戦略最適化の方向性

  1. シグナルフィルタリング最適化:各指標の値を調整することで勝利率を向上させる
  2. タイムサイクル適応:主に日線およびそれ以上のサイクルで使用することを推奨し,異なる市場の特徴に応じてパラメータを調整できます.
  3. ストップロズ最適化:異なる市場状況の動向に応じてATR倍数を調整することを考慮することができます.
  4. 入場時間を最適化:入場の正確性を高めるために,出荷量確認または価格形態確認を追加できます.
  5. ポジション管理の最適化:信号強度に基づいて動的なポジション管理システムを設計できる

要約する

この戦略は,合理的で論理的に明確な設計された総合的な取引システムであり,複数の指標の配合使用により,市場状態のインテリジェント識別と取引機会の精密な捕捉を実現している.低時間周期にはいくつかの問題があるが,日線などの高時間周期では優れたパフォーマンスを発揮している.トレーダーは,現場で使用するときに日線レベルの信号に重点を置くことをお勧めし,自身のリスク承受能力に応じて合理的にパラメータを調整する.継続的な最適化と調整により,この戦略は,取引提供者に安定した収益の機会をもたらす見通しがある.

ストラテジーソースコード
/*backtest
start: 2024-08-01 00:00:00
end: 2025-02-18 08:00:00
period: 2d
basePeriod: 2d
exchanges: [{"eid":"Binance","currency":"ETH_USDT"}]
*/

// This Pine Script™ code is subject to the terms of the Mozilla Public License 2.0 at https://mozilla.org/MPL/2.0/
// © FIWB

//@version=6
strategy("Refined Ichimoku with MACD and RSI Strategy", overlay=true)

// Inputs for Ichimoku Cloud
conversionLength = input.int(9, title="Conversion Line Length", group="Ichimoku Settings")
baseLength = input.int(26, title="Base Line Length", group="Ichimoku Settings")
laggingSpanLength = input.int(52, title="Lagging Span Length", group="Ichimoku Settings")
displacement = input.int(26, title="Displacement", group="Ichimoku Settings")

// Inputs for MACD
macdFastLength = input.int(12, title="MACD Fast Length", group="MACD Settings")
macdSlowLength = input.int(26, title="MACD Slow Length", group="MACD Settings")
macdSignalLength = input.int(9, title="MACD Signal Length", group="MACD Settings")

// Inputs for RSI/Stochastic RSI
rsiLength = input.int(14, title="RSI Length", group="Momentum Indicators")
stochRsiLength = input.int(14, title="Stochastic RSI Length", group="Momentum Indicators")
stochRsiK = input.int(3, title="%K Smoothing", group="Momentum Indicators")
stochRsiD = input.int(3, title="%D Smoothing", group="Momentum Indicators")

// Inputs for ATR
atrLength = input.int(14, title="ATR Length", group="Risk Management")
atrMultiplier = input.float(2.0, title="ATR Multiplier", group="Risk Management")

// Ichimoku Cloud Calculation
conversionLine = (ta.highest(high, conversionLength) + ta.lowest(low, conversionLength)) / 2
baseLine = (ta.highest(high, baseLength) + ta.lowest(low, baseLength)) / 2
leadingSpanA = (conversionLine + baseLine) / 2
leadingSpanB = (ta.highest(high, laggingSpanLength) + ta.lowest(low, laggingSpanLength)) / 2

// Market Regime Detection Using Ichimoku Cloud
priceAboveCloud = close >= leadingSpanA and close >= leadingSpanB
priceBelowCloud = close <= leadingSpanA and close <= leadingSpanB
priceNearCloud = close > leadingSpanB and close < leadingSpanA

trendingMarket = priceAboveCloud or priceBelowCloud
rangeBoundMarket = priceNearCloud

// MACD Calculation
macdLine = ta.ema(close, macdFastLength) - ta.ema(close, macdSlowLength)
macdSignalLine = ta.sma(macdLine, macdSignalLength)
macdHistogram = macdLine - macdSignalLine

// RSI Calculation
rsiValue = ta.rsi(close, rsiLength)

// Stochastic RSI Calculation
stochRsiKValue = ta.sma(ta.stoch(close, high, low, stochRsiLength), stochRsiK)
stochRsiDValue = ta.sma(stochRsiKValue, stochRsiD)

// Entry Conditions with Tightened Filters
trendLongCondition = trendingMarket and priceAboveCloud and rsiValue > 55 and macdHistogram > 0 and stochRsiKValue > stochRsiDValue
trendShortCondition = trendingMarket and priceBelowCloud and rsiValue < 45 and macdHistogram < 0 and stochRsiKValue < stochRsiDValue

rangeLongCondition = rangeBoundMarket and rsiValue < 30 and stochRsiKValue < 20
rangeShortCondition = rangeBoundMarket and rsiValue > 70 and stochRsiKValue > 80

// Risk Management: Stop-Loss Based on ATR
atrValue = ta.atr(atrLength)
longStopLoss = low - atrMultiplier * atrValue
shortStopLoss = high + atrMultiplier * atrValue

// Strategy Execution: Entries and Exits
if trendLongCondition
    strategy.entry("Trend Long", strategy.long)
    strategy.exit("Exit Trend Long", from_entry="Trend Long", stop=longStopLoss)

if trendShortCondition
    strategy.entry("Trend Short", strategy.short)
    strategy.exit("Exit Trend Short", from_entry="Trend Short", stop=shortStopLoss)

if rangeLongCondition
    strategy.entry("Range Long", strategy.long)
    strategy.exit("Exit Range Long", from_entry="Range Long", stop=longStopLoss)

if rangeShortCondition
    strategy.entry("Range Short", strategy.short)
    strategy.exit("Exit Range Short", from_entry="Range Short", stop=shortStopLoss)

// Visualization: Highlight Market Regimes on Chart Background
bgcolor(trendingMarket ? color.new(color.green, 90) : na)
bgcolor(rangeBoundMarket ? color.new(color.red, 90) : na)

// Plot Ichimoku Cloud for Visualization
plot(leadingSpanA, color=color.new(color.green, 80), title="Leading Span A")
plot(leadingSpanB, color=color.new(color.red, 80), title="Leading Span B")