ボラティリティ モメンタム ブレイクアウト トレーディング戦略 トレンドとモメンタム フィルターの組み合わせ

ATR EMA RSI HH LL RR
作成日: 2025-02-20 15:13:31 最終変更日: 2025-02-20 15:13:31
コピー: 1 クリック数: 401
2
フォロー
319
フォロワー

ボラティリティ モメンタム ブレイクアウト トレーディング戦略 トレンドとモメンタム フィルターの組み合わせ ボラティリティ モメンタム ブレイクアウト トレーディング戦略 トレンドとモメンタム フィルターの組み合わせ

概要

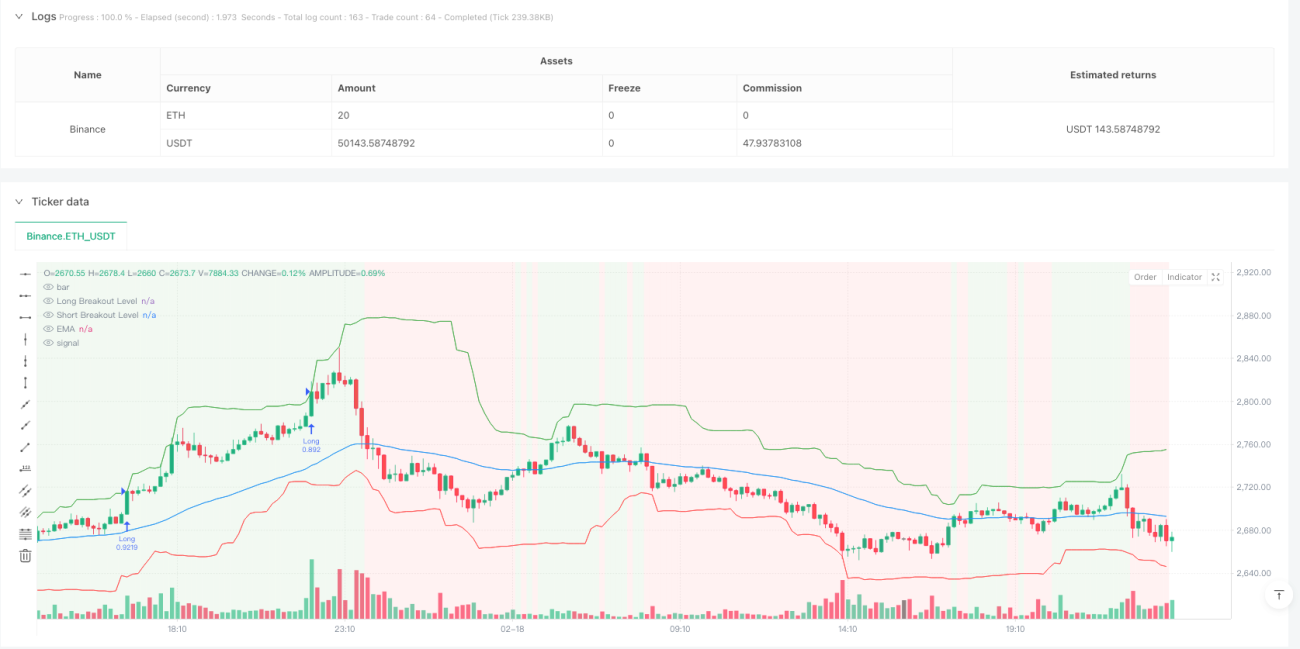
この戦略は,波動率の突破,トレンドの追跡,動力の確認を組み合わせた量化取引システムである.ATRに基づく動的な突破レベルを計算し,EMAのトレンドフィルターとRSIの動力の指標と組み合わせて取引機会を識別する.この戦略は,固定パーセントリスク管理と動的なストップダメージ設定を含む厳格なリスク管理措置を採用している.

戦略原則

戦略は以下の3つのコアで構成されています.

  1. 波動率の突破計算:回帰期間の最高値と最低値を使用して,ATR倍数と組み合わせて動的突破値を計算し,前偏差を回避する.
  2. トレンドフィルター:短期EMAを用いて現在のトレンドの方向を判断し,価格がEMA上にある場合にのみ多発,EMA下にある場合にのみ空券を開く.
  3. 動態確認:RSI指標を使用して市場の動態を確認し,多頭入場はRSIが50より大きいことを要求し,空頭入場はRSIが50より小さいことを要求する.

戦略的優位性

  1. ダイナミックな適応性:突破レベルは市場の変動率に応じて自動的に調整され,戦略が異なる市場環境に適応できるようにする.
  2. 多重フィルタリング:トレンドと動力の指標を組み合わせて偽信号を低減する.
  3. 厳格なリスク管理: 固定リスクパーセントでポジションを管理し,ダイナミック・ストップ・ローズ・プロテクションを使用する.
  4. カスタマイズ性強:ATR周期,突破倍数,EMA周期などの鍵となるパラメータは,特定のニーズに応じて調整できます.

戦略リスク

  1. 遅滞のリスク:移動平均などの指標の使用は,エントリーポイントの遅滞につながる可能性があります.
  2. 振動市場リスク:横盤振動市場では頻繁に偽のブレイクシグナルが生じることがあります.
  3. パラメータ感性: 策略のパフォーマンスは,パラメータ設定に敏感であり,十分にテストする必要があります. 解決:
  • 異なる市場環境で再測定・最適化を行うことを推奨する.
  • 市場環境認識モジュールを追加できます.
  • より保守的な資金管理の提案

戦略最適化の方向性

  1. 市場環境適応:波動率の区間判断を追加し,異なる波動環境で異なるパラメータ設定を使用する.
  2. 信号の最適化: 突破信号の信頼性を高めるため,交差量確認を追加することを検討することができます.
  3. ストップ・ストップ・損失最適化: 動的に調整可能な利益・損失比率,市場の変動に合わせて調整する目標.
  4. タイムフィルター:取引の時間窓のフィルターを追加し,不利な時期に取引を避ける.

要約する

これは,構造が整い,論理が明確で量的な取引戦略である. 変動率の突破,トレンドの追跡,動力の確認を組み合わせることで,リスクを制御しながら,顕著な価格変動を捕捉する. 戦略のカスタマイズ性が強く,異なる取引品種と市場環境に対応するためにさらに最適化するのに適しています.

ストラテジーソースコード
/*backtest
start: 2025-01-20 00:00:00
end: 2025-02-19 00:00:00
period: 10m
basePeriod: 10m
exchanges: [{"eid":"Binance","currency":"ETH_USDT"}]
*/

//@version=5
// Volatility Momentum Breakout Strategy
//
// Description:
// This strategy is designed to capture significant price moves by combining a volatility breakout method
// with a momentum filter. Volatility is measured by the Average True Range (ATR), which is used to set dynamic
// breakout levels. A short‑term Exponential Moving Average (EMA) is applied as a trend filter, and the Relative
// Strength Index (RSI) is used to help avoid entries when the market is overextended.
// 
// Signal Logic:
// • Long Entry: When the current close is above the highest high of the previous N bars (excluding the current bar)
//   plus a multiple of ATR, provided that the price is above the short‑term EMA and the RSI is above 50.
// • Short Entry: When the current close is below the lowest low of the previous N bars (excluding the current bar)
//   minus a multiple of ATR, provided that the price is below the short‑term EMA and the RSI is below 50.
// 
// Risk Management:
// • Trades are sized to risk 2% of account equity.
// • A stop loss is placed at a fixed ATR multiple away from the entry price.
// • A take profit target is set to achieve a 1:2 risk‑reward ratio.
// 
// Backtesting Parameters:
// • Initial Capital: $10,000
// • Commission: 0.1% per trade
// • Slippage: 1 tick per bar
//
// Disclaimer:
// Past performance is not indicative of future results. This strategy is experimental and provided solely for educational
// purposes. Always backtest and paper trade before any live deployment.
//
// Author: [Your Name]
// Date: [Date]

strategy("Volatility Momentum Breakout Strategy", overlay=true, initial_capital=10000, default_qty_type=strategy.percent_of_equity, default_qty_value=5, commission_type=strategy.commission.percent, commission_value=0.1, slippage=1)

// ─── INPUTS ─────────────────────────────────────────────────────────────
atrPeriod       = input.int(14, "ATR Period", minval=1)
atrMultiplier   = input.float(1.5, "ATR Multiplier for Breakout", step=0.1)
lookback        = input.int(20, "Breakout Lookback Period", minval=1)
emaPeriod       = input.int(50, "EMA Period", minval=1)
rsiPeriod       = input.int(14, "RSI Period", minval=1)
rsiLongThresh   = input.float(50, "RSI Long Threshold", step=0.1)
rsiShortThresh  = input.float(50, "RSI Short Threshold", step=0.1)

// Risk management inputs:
riskPercent     = input.float(2.0, "Risk Percent per Trade (%)", step=0.1) * 0.01   // 2% risk per trade
riskReward      = input.float(2.0, "Risk-Reward Ratio", step=0.1)                    // Target profit is 2x risk
atrStopMult     = input.float(1.0, "ATR Multiplier for Stop Loss", step=0.1)         // Stop loss distance in ATRs

// ─── INDICATOR CALCULATIONS ───────────────────────────────────────────────
atrVal   = ta.atr(atrPeriod)
emaVal   = ta.ema(close, emaPeriod)
rsiVal   = ta.rsi(close, rsiPeriod)

// Calculate breakout levels using the highest high and lowest low of the previous N bars,
// excluding the current bar (to avoid look-ahead bias).
highestHigh = ta.highest(high[1], lookback)
lowestLow   = ta.lowest(low[1], lookback)

// Define breakout thresholds.
longBreakoutLevel  = highestHigh + atrMultiplier * atrVal
shortBreakoutLevel = lowestLow  - atrMultiplier * atrVal

// ─── SIGNAL LOGIC ─────────────────────────────────────────────────────────
// Long Entry: Price closes above the long breakout level,
// the close is above the EMA, and RSI > 50.
longCondition = (close > longBreakoutLevel) and (close > emaVal) and (rsiVal > rsiLongThresh)
// Short Entry: Price closes below the short breakout level,
// the close is below the EMA, and RSI < 50.
shortCondition = (close < shortBreakoutLevel) and (close < emaVal) and (rsiVal < rsiShortThresh)

if (longCondition)
    strategy.entry("Long", strategy.long)
if (shortCondition)
    strategy.entry("Short", strategy.short)

// ─── RISK MANAGEMENT ──────────────────────────────────────────────────────
// For each new trade, use the entry price as the basis for stop loss and target calculations.
// We assume the entry price equals the close on the bar where the trade is triggered.
var float longEntryPrice  = na
var float shortEntryPrice = na

// Record entry prices when a trade is opened.
if (strategy.position_size > 0 and na(longEntryPrice))
    longEntryPrice := strategy.position_avg_price
if (strategy.position_size < 0 and na(shortEntryPrice))
    shortEntryPrice := strategy.position_avg_price

// Calculate stop loss and take profit levels based on ATR.
longStop   = longEntryPrice - atrStopMult * atrVal
longTarget = longEntryPrice + (longEntryPrice - longStop) * riskReward
shortStop  = shortEntryPrice + atrStopMult * atrVal
shortTarget= shortEntryPrice - (shortStop - shortEntryPrice) * riskReward

// Issue exit orders if a position is open.
if (strategy.position_size > 0 and not na(longEntryPrice))
    strategy.exit("Long Exit", from_entry="Long", stop=longStop, limit=longTarget)
if (strategy.position_size < 0 and not na(shortEntryPrice))
    strategy.exit("Short Exit", from_entry="Short", stop=shortStop, limit=shortTarget)

// Reset recorded entry prices when the position is closed.
if (strategy.position_size == 0)
    longEntryPrice  := na
    shortEntryPrice := na

// ─── CHART VISUAL AIDS ─────────────────────────────────────────────────────
// Plot the breakout levels and EMA.
plot(longBreakoutLevel, color=color.new(color.green, 0), title="Long Breakout Level", style=plot.style_linebr)
plot(shortBreakoutLevel, color=color.new(color.red, 0), title="Short Breakout Level", style=plot.style_linebr)
plot(emaVal, color=color.blue, title="EMA")

// Optionally, shade the background: green when price is above the EMA (bullish) and red when below.
bgcolor(close > emaVal ? color.new(color.green, 90) : color.new(color.red, 90), title="Trend Background")