
2
Follow
502
Followers
概要
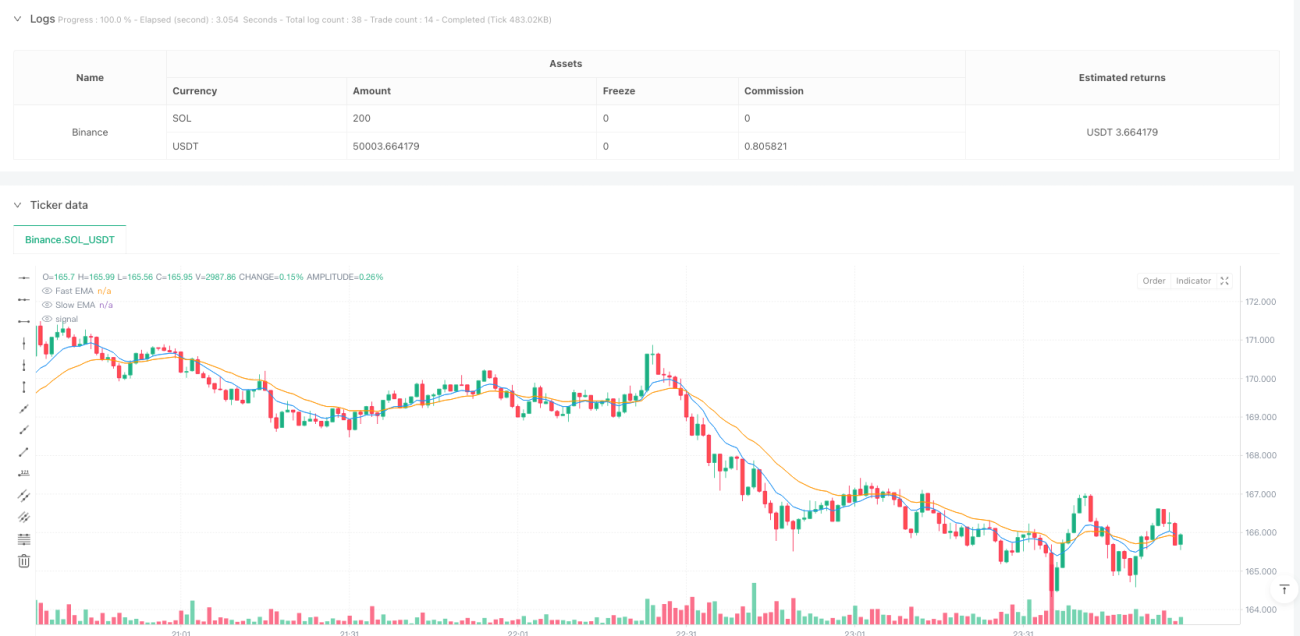
本戦略は、複数のテクニカル指標による確認を基盤としたトレンドフォロー戦略です。移動平均線、モメンタム指標、出来高分析を組み合わせ、売買シグナルをフィルタリングします。戦略は三重のフィルター機構(トレンド方向の判断(EMAクロス)、モメンタム強度の確認(RSIとMACD)、出来高の検証(出来高ブレイクアウトとOBVトレンド))を採用し、ATRに基づくリスク管理体制を備えています。
戦略の原理
戦略は三重確認機構に基づいて動作します。
- トレンド確認層:9期間と21期間の指数平滑移動平均線(EMA)のクロスを用いて全体的なトレンド方向を判断します。短期線が長期線を上抜ければ上昇トレンド、逆に下抜ければ下降トレンドと見なします。
- モメンタム確認層:RSIとMACDの2つのモメンタム指標を組み合わせます。RSIが50より大きく、かつMACDがゴールデンクロスした場合に強気モメンタムを確認します。RSIが50より小さく、かつMACDがデッドクロスした場合に弱気モメンタムを確認します。
- 出来高確認層:出来高が移動平均の1.8倍に達する放量を条件とし、同時にOBV(オン・バランス・ボリューム)のトレンドを通じて出来高と価格の整合性を検証します。
リスク管理には1.5倍のATRをストップロスの基準とし、デフォルトのリスクリワード比率1:2で利益目標を設定します。
戦略の優位性
- 多重フィルター機構により、取引シグナルの信頼性が大幅に向上し、偽シグナルが減少します。
- トレンド、モメンタム、出来高の3つの次元を統合し、市場状態を総合的に評価します。
- ATRに基づく動的ストップロス設定により、市場のボラティリティに応じて自己適応的に調整できます。
- 戦略には視覚化ツールが含まれ、トレーダーがエントリータイミングを直感的に判断するのに役立ちます。
- 異なるボラティリティの資産に対して最適化パラメータの提案を提供します。
戦略のリスク
- 多重フィルター条件により、一部の相場機会を逃す可能性があります。
- レンジ相場では、頻繁な偽のブレイクアウトシグナルが発生する可能性があります。
- 固定のリスクリワード比率は、特定の市場環境では柔軟性に欠ける場合があります。
- 出来高への依存度が高いため、流動性の低い期間に誤ったシグナルを生じる可能性があります。
- EMAパラメータは市場状態に応じて調整する必要があります。
戦略の最適化方向
- 適応型指標パラメータの導入:市場のボラティリティに応じてEMAやRSIの期間を動的に調整する。
- 出来高判断の最適化:相対出来高指標の導入により、異常な出来高の影響を低減する。
- リスク管理の改善:市場ボラティリティに基づく動的なリスクリワード比率調整を実装する。
- 市場環境フィルターの追加:トレンド強度指標を組み込み、強いトレンド期間中はトレーリングストップを採用する。
- エグジット機構の充実:より多くのテクニカル指標を組み合わせ、柔軟なエグジット条件を策定する。
まとめ
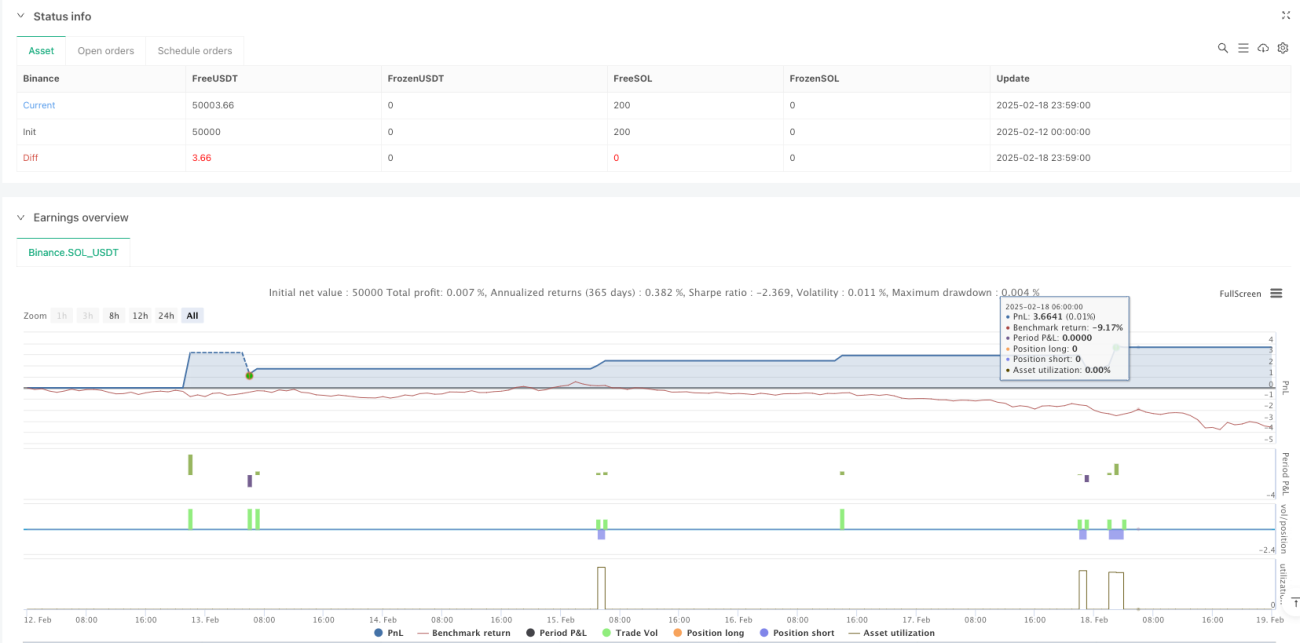
本戦略は、複数のテクニカル指標を統合した多層確認型の取引戦略であり、設計が整っています。比較的信頼性の高い取引シグナルを提供し、リスク管理体制も充実しています。ただし、トレーダーは具体的な市場環境に応じてパラメータの最適化を行う必要があります。この戦略は、ボラティリティが適度で流動性が十分な市場に最も適しており、トレーダーには一定のテクニカル分析の基礎が求められます。
Source
Pine
Strategy parameters
Related strategies
Comment
All comments (0)
No data
- 1