
2
Follow
476
Followers
Let me analyze this trading strategy code and create a comprehensive article in both Chinese and English as requested.
概要
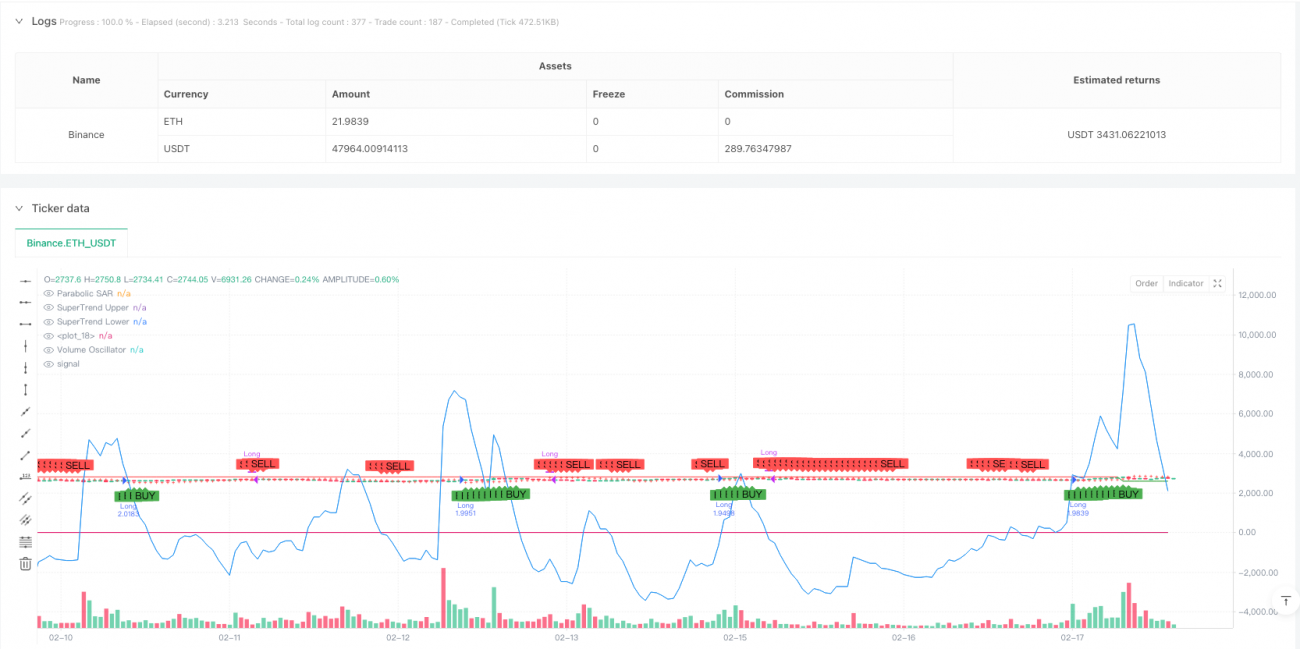
この戦略は,パラパラ線SAR指標,SuperTrend指標,取引量振動器 (Volume Oscillator) を組み合わせた総合的な取引システムである.この戦略は,主に多次元的な技術指標を使用して市場トレンドを確認し,指標間の相互検証によって取引信号の信頼性を高める.戦略設計の核心思想は,傾向,動力,取引量の3次元で信号確認であり,三次元が一致する信号が発生した場合にのみ取引を行う.
戦略原則
この戦略は3つの主要な指標を活用しています.
- パラパラ線SAR ((初期値0.02,加速因子0.02,最大値0.2):価格トレンドの反転点を識別するために用いられ,価格がSAR点の上にあるとき,看板,逆下向きである.
- スーパートレンド ((周期10,倍数3):ATR波動率指標を組み合わせて,動的なトレンドチャネルを生成する.価格が上軌を突破するときに多信号を生成し,下軌を突破するときに空信号を生成する.
- 取引量振動器 ((短期14,長期28):取引量の短期と長期の移動平均を比較して取引活性を測定し,正値は取引量の増加を示し,負値は取引量の減少を示している.
取引シグナル生成ロジック:
- 複数の条件:価格がSAR上位 + SuperTrendの看板 ((価格が下位軌道上位) + 取引量振動器が正である
- 平仓条件:価格がSARの下 + スーパートレンドの下落 ((価格が上線の下) + 取引量振動器は負
戦略的優位性
- 多次元確認:価格の動向,ダイナミックチャネル,取引量の3次元共振によって取引信号を確認し,偽の突破のリスクを大幅に軽減します.
- ダイナミックな適応:スーパートレンド指標はATRのダイナミックな調整によるチャネル幅により,異なる市場の変動環境に適応します.
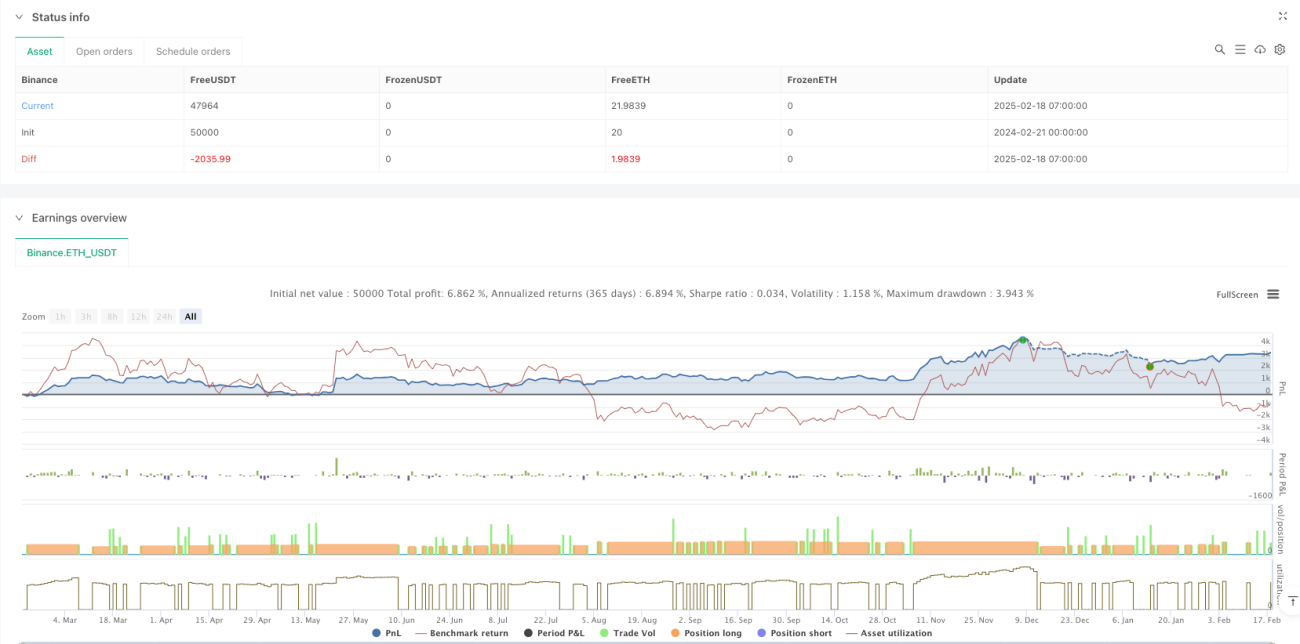
- リスク管理: パーセンテージポジション管理 ((口座の純額の10%に設定) を使用し,各取引のリスクのエッジを効果的に制御します.
- 視覚効果:戦略は,SARポイント,トレンドクラウド,取引シグナルマークを含む明確な視覚的フィードバックを提供します.
戦略リスク
- 振動市場リスク:横盤振動市場では,偽信号が頻繁に発生し,連続したストップ損失を引き起こす可能性があります.
- 遅滞リスク:複数の移動平均類の指標を使用しているため,信号は遅滞しており,最適な入場点を逃す可能性があります.
- パラメータ感性:戦略効果はパラメータ設定に敏感であり,異なる市場環境では異なるパラメータの組み合わせが必要になる可能性がある.
- コストの影響: 取引頻度が高い場合,取引コストが高くなり,全体的な利益に影響する.
戦略最適化の方向性
- 市場環境フィルター: 市場環境認識モジュールを追加し,波動的な市場では自動的にポジションを減額したり取引を一時停止したりすることを推奨する.
- ダイナミックパラメータ最適化:市場の変動率に応じてスーパートレンドのパラメータを自動的に調整して,戦略の適応性を向上させる.
- ストップ・ロスの最適化:トレンドの逆転時に利益をロックするストップ・ロスの追跡機能を追加することが推奨されている.
- 分段最適化:異なる取引時間帯の特性に応じて,シグナルが誘発する<unk>値要求を調整することができる.
- コスト管理: 保有時間制限を高め,頻繁に取引を避ける.
要約する
この戦略は,トレンド追跡と取引量分析を組み合わせて,比較的完全な取引システムを構築している.この戦略の主な特徴は,取引の信頼性を高めるために複数の指標の確認を使用することであり,ビジュアルな設計によってトレーダーに直感的な意思決定参照を提供することです.ある程度の遅れやパラメータの感受性の問題があるものの,合理的な最適化とリスク管理措置によって,この戦略は良い実用価値があります.トレーダーは,現場で使用する場合は,まず,フィットメントによって適切なパラメータの組み合わせを見つけ,市場経験と合わせて柔軟に調整することをお勧めします.
Source
Pine
//@version=5
strategy("Parabolic SAR + SuperTrend + Volume Oscillator Strategy", overlay=true, default_qty_type=strategy.percent_of_equity, default_qty_value=10)

// --- Parabolic SAR Parameters ---
sar_start = 0.02
sar_increment = 0.02
sar_max = 0.2
sar = ta.sar(sar_start, sar_increment, sar_max)
plot(sar, color=color.red, style=plot.style_cross, title="Parabolic SAR")

// --- SuperTrend Parameters ---
st_length = 10Related strategies
Comment
All comments (0)
No data
- 1