
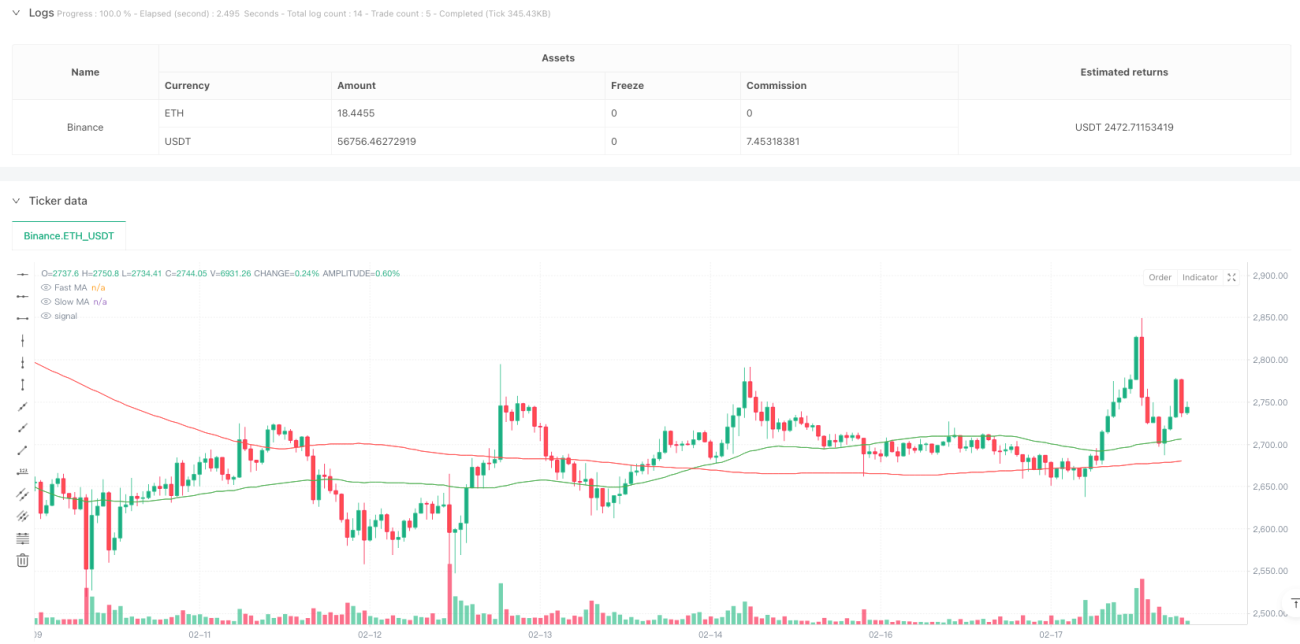
この戦略は,複数の技術指標を組み合わせた量化取引システムであり,移動平均 ((MA),相対的に強い指標 ((RSI) と移動平均の相似散度 ((MACD) の3つのクラシック技術指標の協同配合によって,完全な取引信号システムを構築する. 戦略は,トレンド追跡と動量認識を組み合わせて,取引方向を正しく確保しながら,場場のタイミングの把握にも重点を置く. 同時に,止損,停止,および止損追跡などのリスク制御機構を統合し,体系化された取引戦略を形成する.
この戦略は,主に以下の3つの層で取引シグナルを構築しています.
具体的には,急速平均線 ((50日) 上を緩慢平均線 ((200日) を穿過して金叉を形成し,同時にRSIが超買いレベルに達せずMACDが金叉を形成すると,システムは多信号を生成する.反対に,死叉が発生しRSIが超売りレベルに達せず,MACDが死叉を形成すると,システムは空信号を生成する.
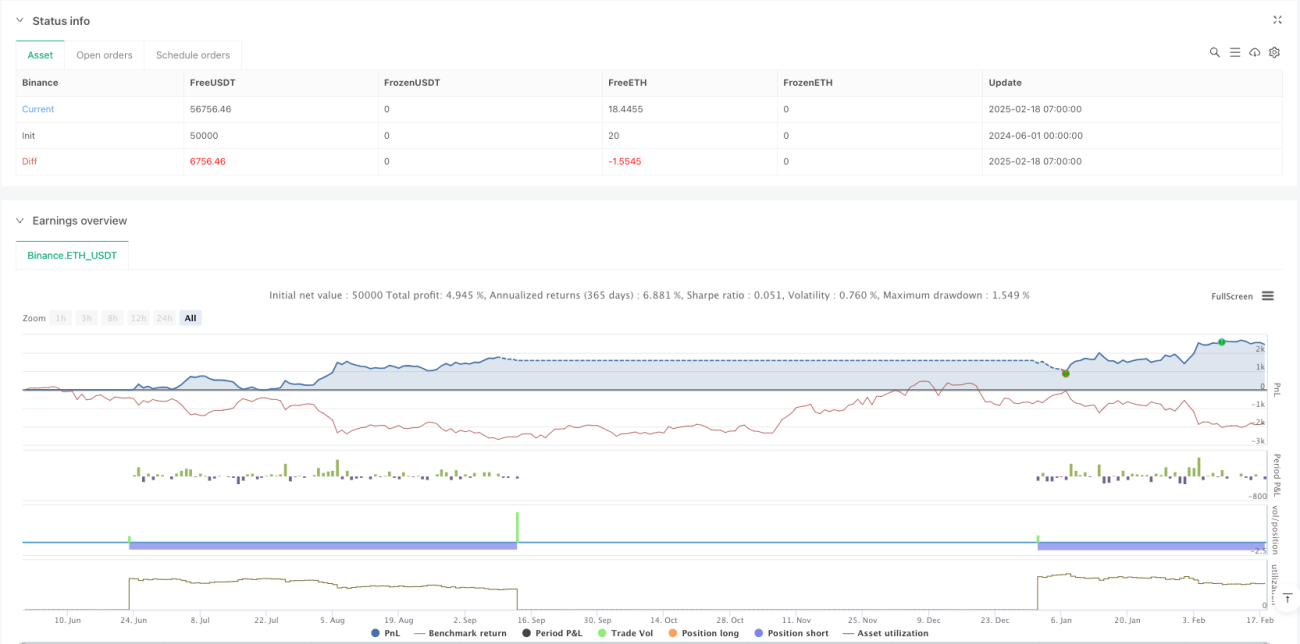
この戦略は,複数の技術指標の協調的な配合によって,比較的完全な取引システムを構築している.戦略は,傾向が明らかな市場でうまく機能するが,実際の市場状況に応じて最適化調整が必要である.トレーダーは,現場で使用する場合は,充分なフィットバック検証を先に行い,自身のリスク承受能力に応じてパラメータを調整するように推奨されている.戦略の核心的な優点は,システム化された信号生成機構と完善したリスク管理システムである.これは,実戦の応用価値に優れている.
/*backtest
start: 2024-06-01 00:00:00
end: 2025-02-18 08:00:00
period: 1h
basePeriod: 1h
exchanges: [{"eid":"Binance","currency":"ETH_USDT"}]
*/
// This Pine Script™ code is subject to the terms of the Mozilla Public License 2.0 at https://mozilla.org/MPL/2.0/
// © EthioTrader
//@version=5
strategy("Optimal Multi-Indicator Strategy", overlay=true, initial_capital=10000, default_qty_type=strategy.percent_of_equity, default_qty_value=10, commission_type=strategy.commission.percent, commission_value=0.1)
// ===== Input Parameters =====
// Moving Averages
fastMA = ta.sma(close, 50)
slowMA = ta.sma(close, 200)
plot(fastMA, "Fast MA", color=color.green)
plot(slowMA, "Slow MA", color=color.red)
// RSI
rsiLength = input(14, "RSI Length")
rsiOverbought = input(70, "RSI Overbought")
rsiOversold = input(30, "RSI Oversold")
rsi = ta.rsi(close, rsiLength)
// MACD
[macdLine, signalLine, _] = ta.macd(close, 12, 26, 9)
// Risk Management
stopLossPerc = input(2.0, "Stop Loss (%)") / 100
takeProfitPerc = input(4.0, "Take Profit (%)") / 100
trailingStopPerc = input(1.0, "Trailing Stop (%)") / 100
// ===== Strategy Logic =====
// Trend Condition: Golden Cross (Fast MA > Slow MA)
bullishTrend = ta.crossover(fastMA, slowMA)
bearishTrend = ta.crossunder(fastMA, slowMA)
// Momentum Condition: RSI and MACD
bullishMomentum = rsi < rsiOverbought and ta.crossover(macdLine, signalLine)
bearishMomentum = rsi > rsiOversold and ta.crossunder(macdLine, signalLine)
// Entry Signals
longCondition = bullishTrend and bullishMomentum
shortCondition = bearishTrend and bearishMomentum
// Exit Signals
trailingStop = strategy.position_avg_price * (1 - trailingStopPerc)
exitLong = ta.crossunder(close, trailingStop) or (close >= strategy.position_avg_price * (1 + takeProfitPerc))
exitShort = ta.crossover(close, trailingStop) or (close <= strategy.position_avg_price * (1 - takeProfitPerc))
// ===== Execute Orders =====
if (longCondition)
strategy.entry("Long", strategy.long)
strategy.exit("Exit Long", "Long", stop=strategy.position_avg_price * (1 - stopLossPerc), limit=strategy.position_avg_price * (1 + takeProfitPerc), trail_price=trailingStop, trail_offset=trailingStopPerc * close)
if (shortCondition)
strategy.entry("Short", strategy.short)
strategy.exit("Exit Short", "Short", stop=strategy.position_avg_price * (1 + stopLossPerc), limit=strategy.position_avg_price * (1 - takeProfitPerc), trail_price=trailingStop, trail_offset=trailingStopPerc * close)
// ===== Plotting =====
plotshape(series=longCondition, title="Buy Signal", location=location.belowbar, color=color.green, style=shape.labelup, text="BUY")
plotshape(series=shortCondition, title="Sell Signal", location=location.abovebar, color=color.red, style=shape.labeldown, text="SELL")