トリプルボリンジャーバンド標準偏差トレンドフォロー戦略

2
Follow
476
Followers
概要
この戦略は,ブリン帯の標準差に基づくトレンド追跡取引システムである.戦略は,ブリン帯の下位と相関する3つの連続した<unk>線の位置関係を観察することによって,トレンドの強さを判断し,トレンドが確立されたときに取引する.システムは,固定リスク/利益の比率を用い,各取引のリスクを管理する.
戦略原則
戦略の中核となるロジックは、次の点に基づいています。
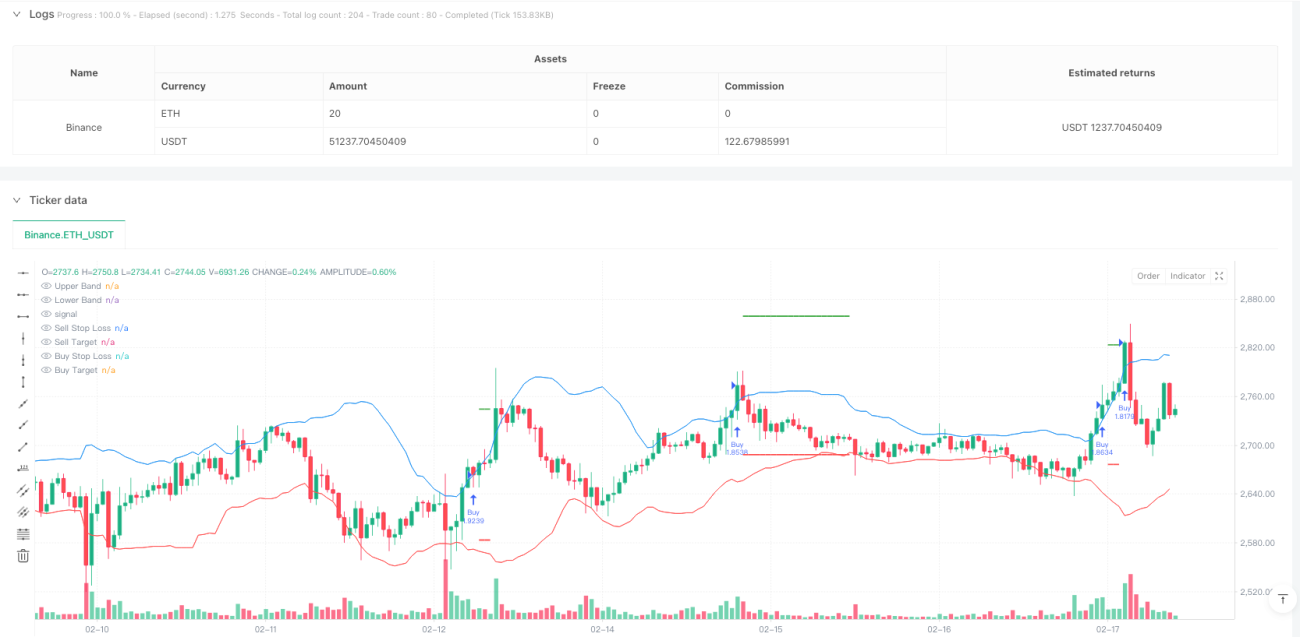
- 20周期移動平均をブリン帯の中軌道として使用し,2倍標準差を上下軌道として計算する.
- 連続した3つの<unk>線の閉盤価格が上線上にあるとき,システムは上昇傾向が確立されていると考え,第3の<unk>線の閉盤時に入場をする.
- 連続した3つの<unk>線の閉盘価格が下線の下にあるとき,システムは下落傾向が確立していると考え,第3の<unk>線の閉盘時に入場空調を行う.
- 止損は,入場信号の最初の<unk>線の極限値に設定する.
- 目標価格の設定は,1:1のリスク/利益比率を採用し,つまり,利益の目標距離は止損距離に等しい.
戦略的優位性
- 信号確認機構は堅牢である - ブリン帯域を連続して3本の<unk>線が突破することを要求し,偽突破のリスクを効果的に低減した.
- リスク管理は合理的 - 固定的リスク/利益比で取引管理を行い,単一の取引で過度の損失を避ける.
- トレンド追跡効果は顕著である - ブリン帯の標準差特性は,戦略を市場の変動率の変化に適応させるようにする.
- 実行ルールは明確である - 入場,止損,および利益の目標の設定には,主観的な判断を必要としない明確な量化基準がある.
戦略リスク
- 横軸市場の不具合 - 明らかなトレンドがない市場では頻繁に偽信号が生じることがあります.
- 入場時間が遅れており,入場には3つの電話の確認が必要で,初期段階のイベントを逃す可能性もあります.
- 固定リスク/利益の比率の制限 - 1: 1のリスク/利益比率は,強いトレンドの利回り部位を早めに締めくくった可能性があります.
- トレンド強度フィルターの欠如 - 他のトレンド確認指標を考慮せずに,価格とブリン帯の関係のみに基づいて判断する.
戦略最適化の方向性
- トレンド強度フィルターを増やす - ADXまたはMACDなどのトレンド指標を導入して信号の質を向上させることができる.
- リスク/利益の比率を最適化設定 - 市場の変動率の動向に応じてリスク/利益の比率を調整することができる.
- ストップ・メカニズムを改良する - 移動ストップまたは分期利益のメカニズムを増やすことを検討し,大きなトレンドを把握する.
- 取引量確認を追加 - 取引量突破確認を信号生成時に追加し,信号信頼性を向上させる.
要約する
これは,合理的に設計されたトレンド追跡戦略で,ブリン帯と複数の確認機構によって市場トレンドを捉えるための戦略である.戦略のリスク管理の枠組みは完善し,実行基準は明確である.ある程度の遅れがあるものの,推奨された最適化の方向によって戦略の安定性と収益性をさらに向上させることができる.傾向追跡を好み,リスク管理に重点を置くトレーダーにとって,これは参考にすべき戦略の枠組みである.
Source
Pine
/*backtest
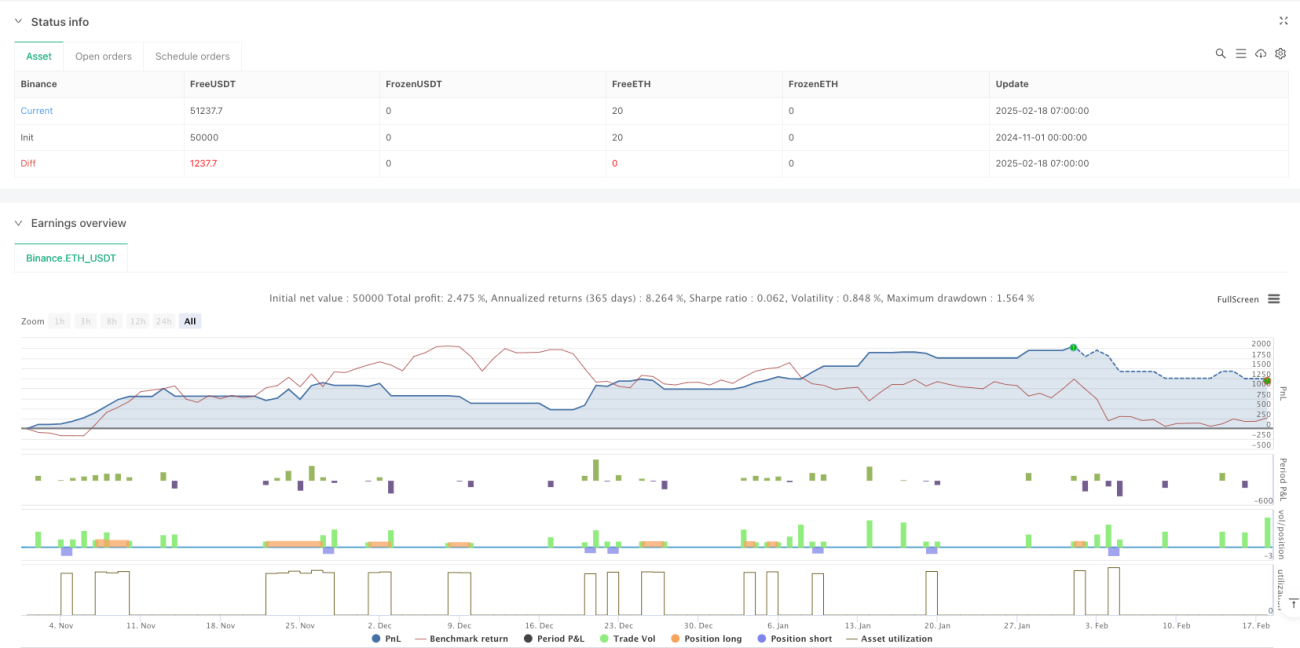
start: 2024-11-01 00:00:00
end: 2025-02-18 08:00:00
period: 1h
basePeriod: 1h
exchanges: [{"eid":"Binance","currency":"ETH_USDT"}]
*/
//@version=6
strategy("Bollinger Band Buy and Sell Strategy (Entry at Close of 3rd Candle)", overlay=true, default_qty_type=strategy.percent_of_equity, default_qty_value=10, pyramiding=0)
// Bollinger Band settingsStrategy parameters
Related strategies
Comment
All comments (0)
No data
- 1