複数の指標トレンドクロスオーバーとATRダイナミックボラティリティ戦略の組み合わせ

RSI SMA MACD ATR MA TP SL
作成日: 2025-02-20 16:28:37 最終変更日: 2025-02-27 17:30:15
コピー: 0 クリック数: 366
2
フォロー
319
フォロワー

複数の指標トレンドクロスオーバーとATRダイナミックボラティリティ戦略の組み合わせ 複数の指標トレンドクロスオーバーとATRダイナミックボラティリティ戦略の組み合わせ

概要

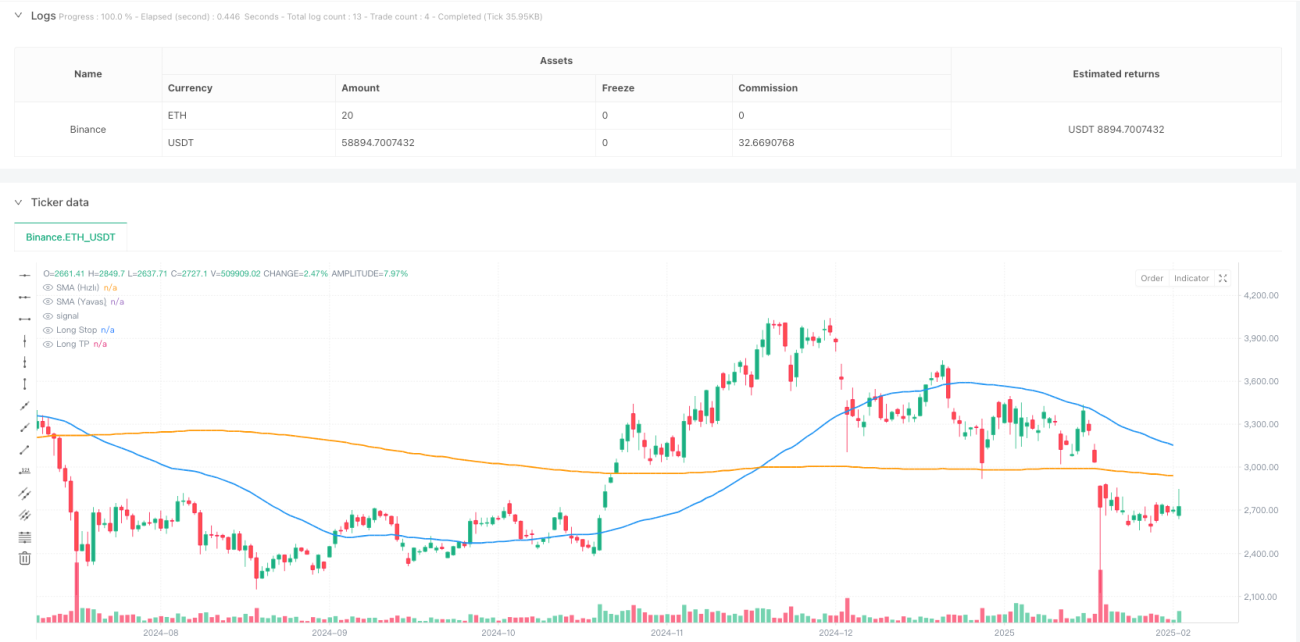
この戦略は,複数の技術指標を組み合わせたトレンド追跡システムである.これは,主にRSI,MACD,SMAの交差信号に基づいて取引方向を決定し,ATR指標を使用してストップと利益のレベルを動的に調整する.この戦略は,十分な市場の流動性の下で取引を確実にするために取引量フィルタを統合し,資金管理を最適化するために部分的なストップメカニズムを使用する.

戦略原則

この戦略は,取引信号を確認するために,三重検証の仕組みを使用しています.

  1. 50日平均線と200日平均線の位置関係から主要なトレンド方向を判断する
  2. RSIを活用して,超買いと超売り領域の交差点から入場のタイミングを探します.
  3. MACD指標と組み合わせてトレンド動力を確認
  4. 取引量フィルターを使用して十分な市場流動性を確保する
  5. ATR ベースのダイナミックなストップ・ローズと収益目標設定

多重検証の目的は,偽信号を減らし,取引の正確性を向上させることである.戦略は,複数の条件が満たされているときに ((上向きトレンド+RSIで40+MACDを上向きに+取引量確認) を開設し,ATRの2倍をストップ・ロスとして使用し,4倍をストップ・キャップとして使用する.

戦略的優位性

  1. 複数の技術指標のクロス検証により,偽信号を低減する
  2. 市場状況に適応する動的な変動率の停止メカニズム
  3. 部分停止戦略を適用し,上の余地を維持しながら部分利益をロックします.
  4. 取引量フィルタリングにより,十分な流動性を確保
  5. 固定ストップ,トラッキングストップ,部分利益を含む完全なリスク管理システム

戦略リスク

  1. 複数の指標により,一部の取引機会を逃す可能性があります.
  2. 不安定な市場では大きな下落に見舞われる可能性がある
  3. 過度なパラメータ最適化は過剰適合につながる可能性がある
  4. 流動性の低い市場では,取引量フィルタリングでチャンスを逃す可能性があります.
  5. ダイナミック・ストップダメージは,高波動期間に早めにトリガーされる可能性があります.

戦略最適化の方向性

  1. 市場変動の適応メカニズムの導入を検討し,異なる変動環境下でのパラメータの動的調整
  2. 多周期分析を導入し,トレンド判断の正確性を向上させる
  3. 部分停止比率を最適化し,異なる市場環境で停止戦略を調整する
  4. トレンド強度フィルターを追加し,弱トレンド環境での取引を避ける
  5. 季節的な要素の分析を考慮し,取引のタイミングを最適化する

要約する

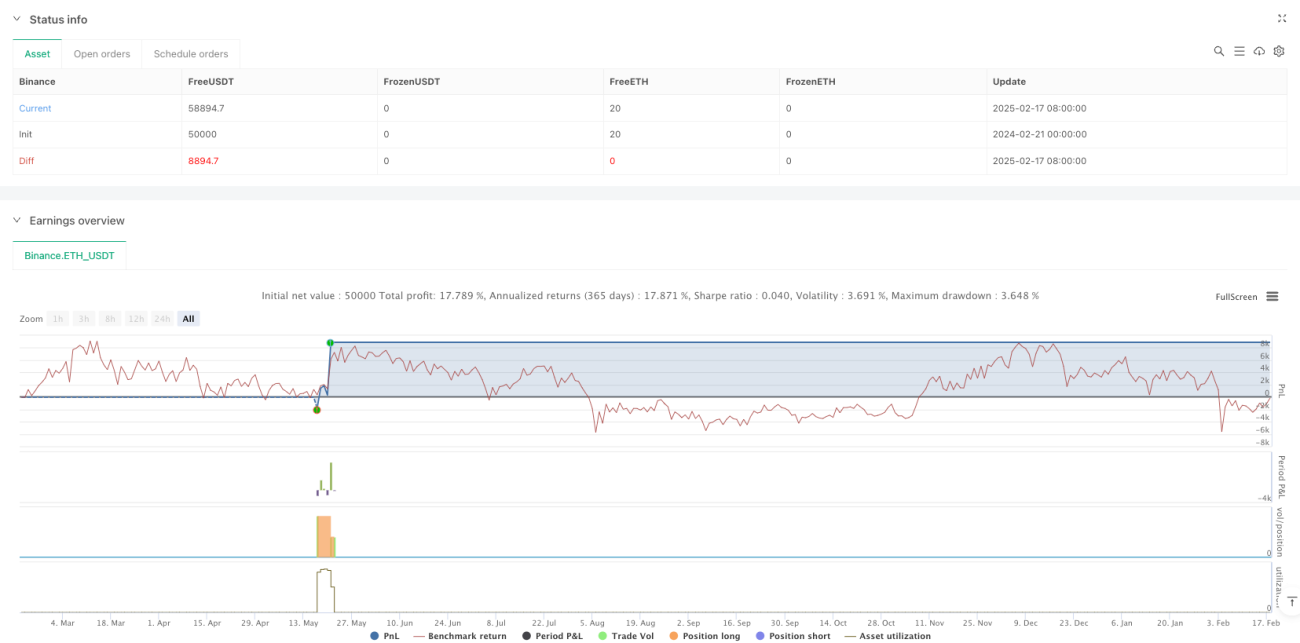
これは,複数の技術指標の配合による全面的なトレンド追跡戦略であり,安定した取引システムを構築しています. この戦略の主な特徴は,安全性を保ちながら,ダイナミックな止損と利益の仕組みを通じて,市場の変化に適応することです. 優化が必要な場所があるものの,全体的な枠組みは合理的で,さらなる改善と実地テストに適しています.

ストラテジーソースコード
/*backtest
start: 2024-02-21 00:00:00
end: 2025-02-18 08:00:00
period: 1d
basePeriod: 1d
exchanges: [{"eid":"Binance","currency":"ETH_USDT"}]
*/

//@version=5
strategy(    title="AI Trade Strategy v2 (Extended) - Fixed",    shorttitle="AI_Trade_v2",    overlay=true,    format=format.price,    initial_capital=100000,    default_qty_type=strategy.percent_of_equity,    default_qty_value=100,    pyramiding=0)

//============================================================================
//=== 1) Basic Indicators (SMA, RSI, MACD) ==================================
//============================================================================

// Time Filter (optional, you can update)
inDateRange = (time >= timestamp("2018-01-01T00:00:00")) and (time <= timestamp("2069-01-01T00:00:00"))

// RSI Parameters
rsiLength  = input.int(14, "RSI Period")
rsiOB      = input.int(60, "RSI Overbought Level")
rsiOS      = input.int(40, "RSI Oversold Level")
rsiSignal  = ta.rsi(close, rsiLength)

// SMA Parameters
smaFastLen = input.int(50, "SMA Fast Period")
smaSlowLen = input.int(200, "SMA Slow Period")
smaFast    = ta.sma(close, smaFastLen)
smaSlow    = ta.sma(close, smaSlowLen)

// MACD Parameters
fastLength     = input.int(12, "MACD Fast Period")
slowLength     = input.int(26, "MACD Slow Period")
signalLength   = input.int(9,  "MACD Signal Period")
[macdLine, signalLine, histLine] = ta.macd(close, fastLength, slowLength, signalLength)

//============================================================================
//=== 2) Additional Filter (Volume) ========================================
//============================================================================
useVolumeFilter    = input.bool(true, "Use Volume Filter?")
volumeMaPeriod     = input.int(20, "Volume MA Period")
volumeMa           = ta.sma(volume, volumeMaPeriod)

// If volume filter is enabled, current bar volume should be greater than x times the average volume
volMultiplier = input.float(1.0, "Volume Multiplier (Volume > x * MA)")
volumeFilter  = not useVolumeFilter or (volume > volumeMa * volMultiplier)

//============================================================================
//=== 3) Trend Conditions (SMA) ============================================
//============================================================================
isBullTrend = smaFast > smaSlow
isBearTrend = smaFast < smaSlow

//============================================================================
//=== 4) Entry Conditions (RSI + MACD + Trend + Volume) ====================
//============================================================================

// RSI crossing above 30 + Bullish Trend + Positive MACD + Volume Filter
longCondition = isBullTrend    and ta.crossover(rsiSignal, rsiOS)    and (macdLine > signalLine)    and volumeFilter 
shortCondition = isBearTrend    and ta.crossunder(rsiSignal, rsiOB)    and (macdLine < signalLine)    and volumeFilter

//============================================================================
//=== 5) ATR-based Stop + Trailing Stop ===================================
//============================================================================
atrPeriod       = input.int(14, "ATR Period")
atrMultiplierSL = input.float(2.0, "Stop Loss ATR Multiplier")
atrMultiplierTP = input.float(4.0, "Take Profit ATR Multiplier")

atrValue = ta.atr(atrPeriod)

//============================================================================
//=== 6) Trade (Position) Management ======================================
//============================================================================
if inDateRange
    //--- Long Entry ---
    if longCondition
        strategy.entry(id="Long", direction=strategy.long, comment="Long Entry")

    //--- Short Entry ---
    if shortCondition
        strategy.entry(id="Short", direction=strategy.short, comment="Short Entry")

    //--- Stop & TP for Long Position ---
    if strategy.position_size > 0
        // ATR-based fixed Stop & TP calculation
        longStopPrice  = strategy.position_avg_price - atrValue * atrMultiplierSL
        longTakeProfit = strategy.position_avg_price + atrValue * atrMultiplierTP

        // PARTIAL EXIT: (Example) take 50% of the position at early TP
        partialTP = strategy.position_avg_price + (atrValue * 2.5)
        strategy.exit(            id         = "Partial TP Long",            stop       = na,            limit      = partialTP,            qty_percent= 50,            from_entry = "Long"        )

        // Trailing Stop + Final ATR Stop
        // WARNING: trail_offset=... is the offset in price units.
        // For example, in BTCUSDT, a value like 300 means a 300 USDT trailing distance.
        float trailingDist = atrValue * 1.5
        strategy.exit(            id          = "Long Exit (Trail)",            stop        = longStopPrice,            limit       = longTakeProfit,            from_entry  = "Long",            trail_offset= trailingDist        )

    //--- Stop & TP for Short Position ---
    if strategy.position_size < 0
        // ATR-based fixed Stop & TP calculation for Short
        shortStopPrice  = strategy.position_avg_price + atrValue * atrMultiplierSL
        shortTakeProfit = strategy.position_avg_price - atrValue * atrMultiplierTP

        // PARTIAL EXIT: (Example) take 50% of the position at early TP
        partialTPShort = strategy.position_avg_price - (atrValue * 2.5)
        strategy.exit(            id         = "Partial TP Short",            stop       = na,            limit      = partialTPShort,            qty_percent= 50,            from_entry = "Short"        )

        // Trailing Stop + Final ATR Stop for Short
        float trailingDistShort = atrValue * 1.5
        strategy.exit(            id          = "Short Exit (Trail)",            stop        = shortStopPrice,            limit       = shortTakeProfit,            from_entry  = "Short",            trail_offset= trailingDistShort        )

//============================================================================
//=== 7) Plot on Chart (SMA, etc.) =========================================
//============================================================================
plot(smaFast, color=color.blue,   linewidth=2, title="SMA (Fast)")
plot(smaSlow, color=color.orange, linewidth=2, title="SMA (Slow)")

// (Optional) Plot Stop & TP levels dynamically:
longStopForPlot  = strategy.position_size > 0 ? strategy.position_avg_price - atrValue * atrMultiplierSL : na
longTPForPlot    = strategy.position_size > 0 ? strategy.position_avg_price + atrValue * atrMultiplierTP : na
shortStopForPlot = strategy.position_size < 0 ? strategy.position_avg_price + atrValue * atrMultiplierSL : na
shortTPForPlot   = strategy.position_size < 0 ? strategy.position_avg_price - atrValue * atrMultiplierTP : na

plot(longStopForPlot,  color=color.red,   style=plot.style_linebr, title="Long Stop")
plot(longTPForPlot,    color=color.green, style=plot.style_linebr, title="Long TP")
plot(shortStopForPlot, color=color.red,   style=plot.style_linebr, title="Short Stop")
plot(shortTPForPlot,   color=color.green, style=plot.style_linebr, title="Short TP")