
2
Follow
475
Followers
概要
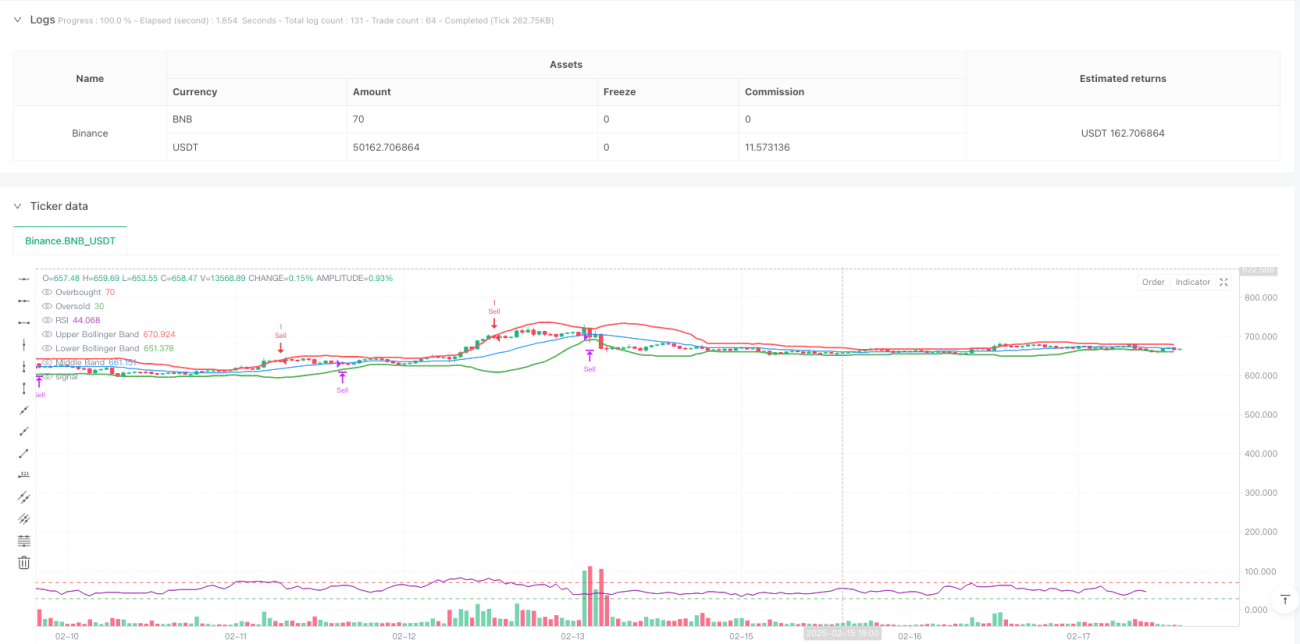
この戦略は,ブリン帯 (Bollinger Bands) と比較的強い指標 (RSI) を組み合わせた技術分析取引システムである.これは,価格の変動と市場の動力の特性を主に利用し,オーバーバイオーバーセール領域で取引の機会を探している.この戦略は,RSI指標がオーバーバイ (Bollinger Bands) を30以下で,価格がブリン帯を突破して下線したときに買入シグナルを生成する.RSI指標がオーバーバイ (Bollinger Bands) を70以上で,価格がブリン帯を突破して上線したときに売り出シグナルを生成する.同時に,ブリン帯の軌道で損失位置として使用する.
戦略原則
戦略の中核となるロジックは、次の主要な要素に基づいています。
- ブリン帯のパラメータ設定は20周期移動平均を中道として採用し,標準差倍数は2.0である.
- RSIパラメータは従来の14サイクル設定を使用
- 応募条件:
- 買い物:価格が上昇してブリン帯下落線を突破し,RSI<30
- 売出:価格は下方へ ブリン帯を突破し,RSI>70で軌道に乗る
- 出場条件:価格とブリン帯の中軌道 ((20周期移動平均線) が交差する時に平仓
この組み合わせは,価格の統計的性質を考慮するとともに,動力の指標と組み合わせて,取引の正確性を効果的に向上させています.
戦略的優位性
- 多重確認メカニズム:価格と動力の指標を組み合わせて,偽信号を減らす
- リスク管理の合理性:ブリン帯中線をストップポイントとして使用し,利益を保護すると同時にリスクを管理する
- 適応性:ブリン帯は市場の変動に応じて自動的に帯域を調整する
- パラメータ設定のクラシック:広範に検証されたパラメータの組み合わせを使用して,戦略の安定性を向上させる
- 論理的明瞭性:取引規則が明確で,追及と実盤操作が容易である
戦略リスク
- 横盤市場で頻繁に取引が起こる可能性
- トレンド・マーケット・リスク:強気なトレンドで部分を見逃す可能性
- パラメータの感受性: ブリン帯周期とRSI設定は,戦略のパフォーマンスに大きな影響を与える
- スライドポイントの影響: 価格が急激に変動するときに大きなスライドポイントに直面する可能性がある
リスクを管理するために、次の対策が推奨されます。
- 適切なポジションコントロールを設定する
- トレンドフィルターを追加
- 最適化パラメータの自己適応機構
- 取引コストを考慮して再評価
戦略最適化の方向性
- 動的パラメータ最適化:
- 市場変動率に動的に調整されたブリン帯のパラメータ
- 市場環境によるRSI値下げ調整
- 補助指標を追加する
- 添付量確認
- トレンド指標をフィルターとして考える
- ストップロスのメカニズムを改善する:
- 追跡停止を導入する
- 最大損失限度額を設定する
- 取引実行の最適化:
- ポジションの一部を取引する
- 入場価格の最適化論理を追加する
要約する
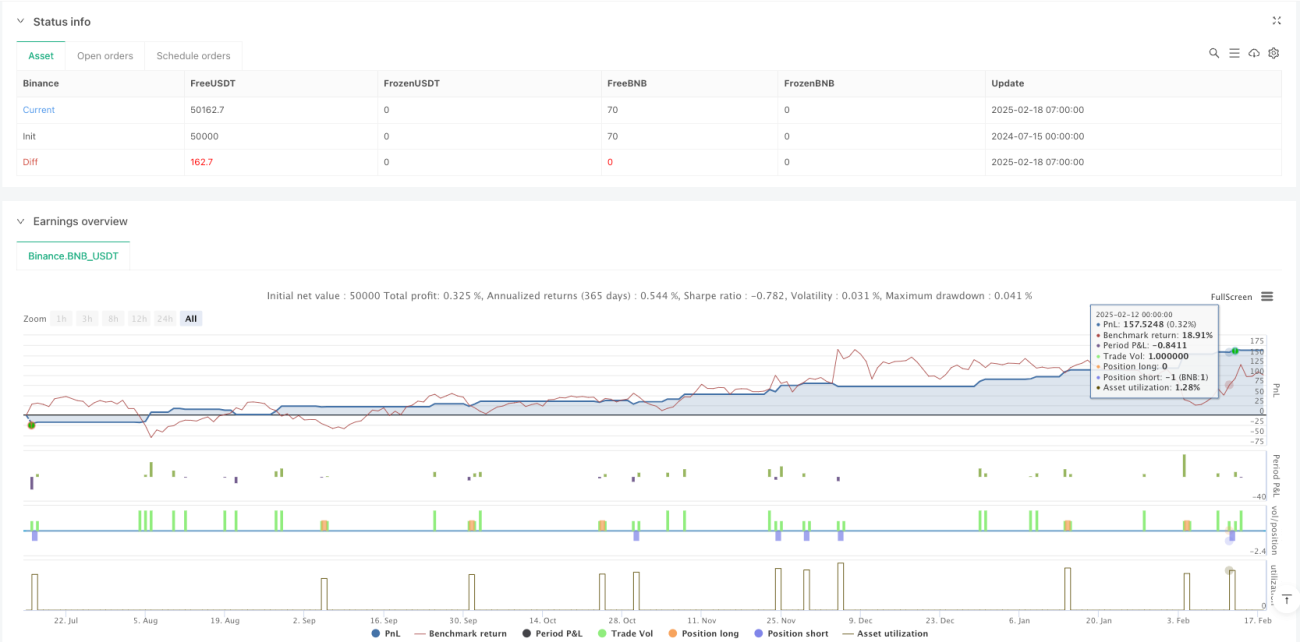
この戦略は,ブリン帯とRSI指標を組み合わせて,比較的完全な取引システムを構築している.戦略の論理は明確で,リスク管理は合理的で,実用的な価値がある.推奨された最適化方向によって,戦略はさらに向上する余地がある.実際の適用では,投資家が自身のリスク承受能力と市場環境に応じて適切な調整を行うことを推奨している.
Source
Pine
Strategy parameters
Related strategies
Comment
All comments (0)
No data
- 1