マルチバンド統計トレンド分析戦略

BB SMA EMA SD PL QB
作成日: 2025-02-20 16:45:59 最終変更日: 2025-02-20 16:45:59
コピー: 1 クリック数: 348
2
フォロー
319
フォロワー

マルチバンド統計トレンド分析戦略 マルチバンド統計トレンド分析戦略

概要

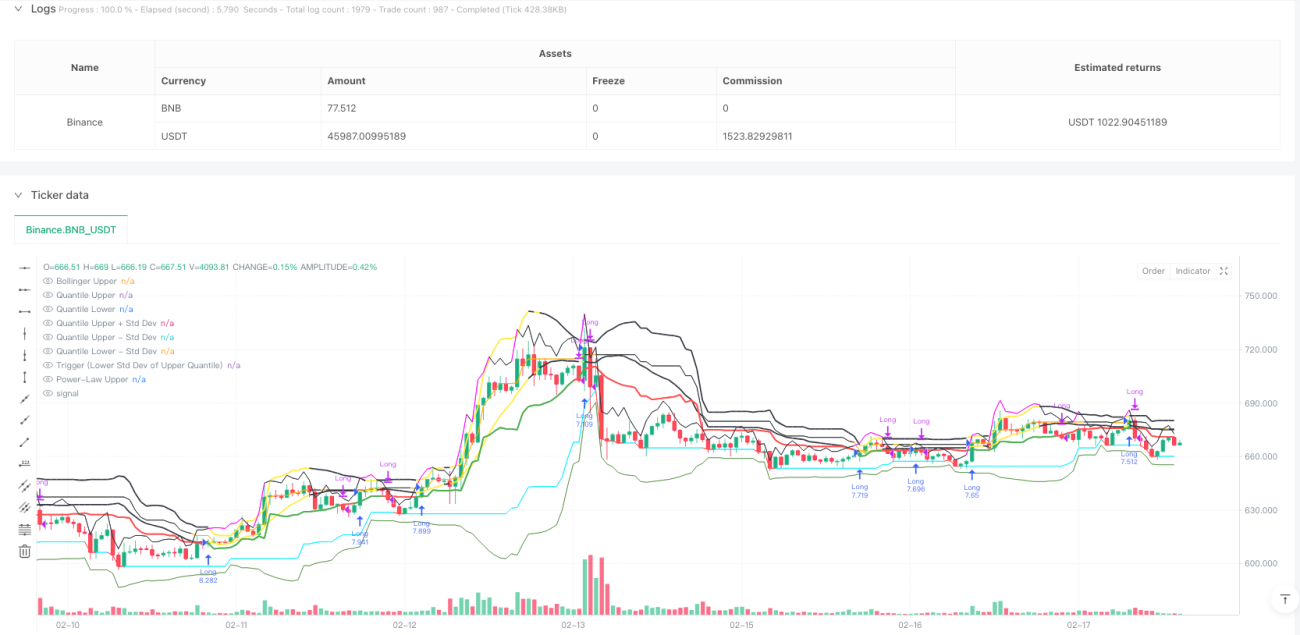
これは,複数の統計帯とトレンド分析に基づいた取引戦略である.この戦略は,ブリン帯,分数帯,律を組み合わせて,重要なサポート/レジスタンス領域を識別し,上位分数帯の下位標準差をトリガー信号として使用して,入場と出場のタイミングを決定する.この戦略は,市場の変動を十分に考慮して設計されており,複数の統計手法を重ねて信号の信頼性を高めています.

戦略原則

策略の核心原則は,複数の統計帯の交差によって市場動向を捉えることです.主に以下のいくつかの重要な構成要素が含まれています:

  1. ブリン帯システム - 価格変動区間を判断するために使用され,価格が上線を突破すると黄色い警告に変化する.
  2. 分数帯システム - 価格の上下分数を計算し,価格の極値確率を評価する.
  3. 律帯システム - 歴史的リターンに基づいて計算される有意性レベル. 過買過売を測定するために使用される.
  4. トリガーシステム - 上記の分数帯の下の標準差線が主要なトリガー信号であり,その線上での価格維持は看板信号とみなされる.
  5. 確認システム - 連続した確認K線数設定によって偽信号をフィルターする.

戦略的優位性

  1. 信号の安定性 - 複数の統計帯の重複使用は,偽信号を効果的に減少させる.
  2. 適応性 - 戦略は異なる時間周期と市場条件に適応できます.
  3. リスク管理の完善 - 多重な統計によってリスクゾーンを区分し,同時に止損メカニズムがあります.
  4. パラメータの柔軟性 - 市場特性に合わせて最適化できる豊富なパラメータの選択肢を提供します.
  5. 視覚的明晰さ - 各種指標線の色ははっきりと区別され,取引信号は直感的である.

戦略リスク

  1. 遅滞の危険性 - 統計指標は遅滞の危険性があり,最適な入場点を逃す可能性があります.
  2. 振動市場には不利である - 横軸振動市場では過剰な取引信号が生じる可能性がある.
  3. パラメータの感度 - パラメータの組み合わせによって効果の差が大きいため,繰り返し最適化が必要である.
  4. 計算負荷が大きい - 多数の統計指標のリアルタイム計算には,大きな計算リソースが必要である.
  5. 市場環境依存 - 極端な市場環境では統計法則が効かないかもしれない.

戦略最適化の方向性

  1. ダイナミックパラメータの導入 - 市場の変動に応じてパラメータを自動的に調整する.
  2. 市場環境の判断を増やす - 傾向の強さの指標を追加して,波動の市場信号をフィルターする.
  3. 計算効率の最適化 - 計算過程の一部を簡素化し,リソースの占有量を減らす.
  4. リスク管理の改善 - ストップ・オフ条件とポジション管理策の追加
  5. 適応性を強化する - 適応型パラメータ最適化システムを開発する

要約する

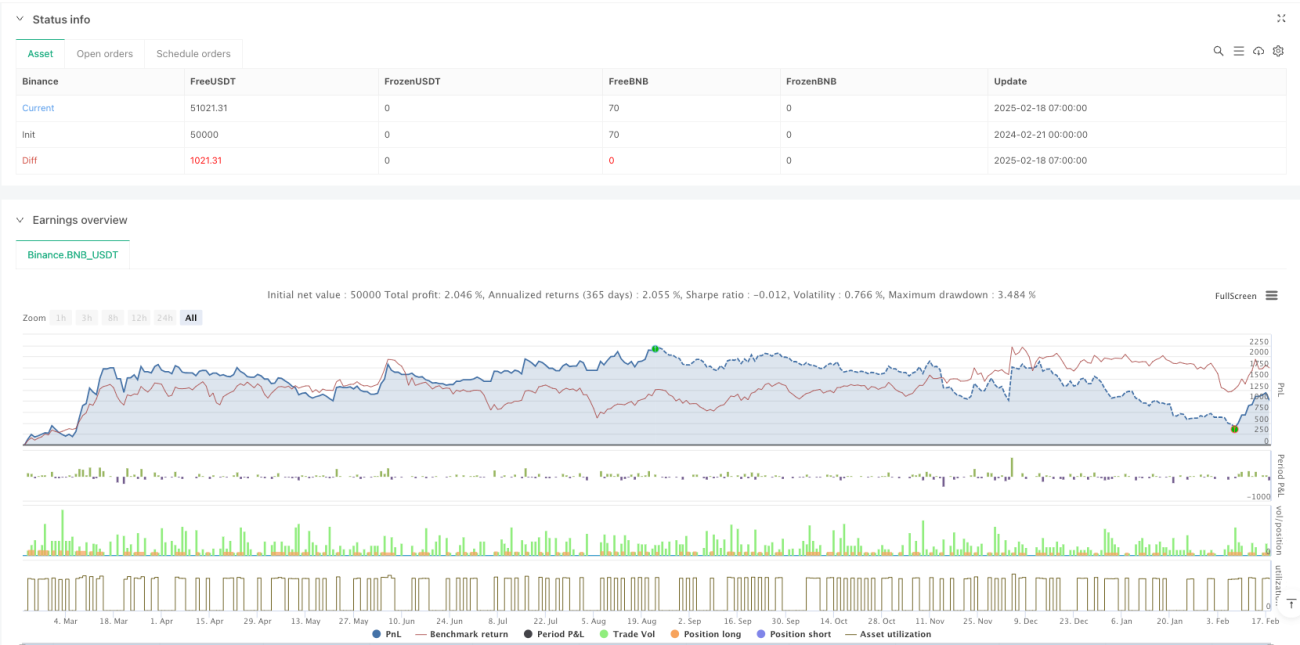
これは,複数の統計的手法を融合した総合的なトレンド追跡戦略である.ブリン帯,分数帯,律帯の協同作用により,市場トレンドをよりよく把握することができ,同時に,優れたリスク管理能力を有している.ある程度の遅れやパラメータ最適化の難しさがあるにもかかわらず,継続的な改善と最適化により,この戦略は,優れた実用価値と発展の見通しを持っている.

ストラテジーソースコード
/*backtest
start: 2024-02-21 00:00:00
end: 2025-02-18 08:00:00
period: 1h
basePeriod: 1h
exchanges: [{"eid":"Binance","currency":"BNB_USDT"}]
*/

//@version=6
strategy("Multi-Band Comparison Strategy with Separate Entry/Exit Confirmation", overlay=true, 
         default_qty_type=strategy.percent_of_equity, default_qty_value=10, 
         initial_capital=5000, currency=currency.USD)

// === Inputs ===

// Basic Parameters
length         = input.int(20, "Length (SMA)", minval=1)
boll_mult      = input.float(1.0, "Bollinger Band Multiplier", minval=0.1, step=0.1)
upper_quantile = input.float(0.95, "Upper Quantile (0.0-1.0)", minval=0.0, maxval=1.0)
lower_quantile = input.float(0.05, "Lower Quantile (0.0-1.0)", minval=0.0, maxval=1.0)

// Separate confirmation inputs
entry_confirmBars = input.int(1, "Entry Confirmation Bars", minval=1, tooltip="Number of consecutive bars the entry condition must hold")
exit_confirmBars  = input.int(1, "Exit Confirmation Bars",  minval=1, tooltip="Number of consecutive bars the exit condition must hold")

// Toggle Visibility for Bands
show_lower_boll  = input.bool(false, "Show Lower Bollinger Band", tooltip="Enable or disable the lower Bollinger Band")
show_upper_boll  = input.bool(true,  "Show Upper Bollinger Band", tooltip="Enable or disable the upper Bollinger Band")
show_lower_quant = input.bool(true, "Show Lower Quantile Band", tooltip="Enable or disable the lower Quantile Band")
show_upper_quant = input.bool(true,  "Show Upper Quantile Band", tooltip="Enable or disable the upper Quantile Band")
show_upper_power = input.bool(true,  "Show Upper Power-Law Band", tooltip="Enable or disable the upper Power-Law Band")
show_lower_power = input.bool(false, "Show Lower Power-Law Band", tooltip="Enable or disable the lower Power-Law Band")
show_quant_std   = input.bool(true,  "Show Standard Deviation around Quantile Bands", tooltip="Enable or disable standard deviation lines around Quantile Bands")

// Individual Toggles for Std Dev Lines
show_upper_quant_std_up   = input.bool(true,  "Show Upper Quantile + Std Dev", tooltip="Enable or disable the Upper Quantile + Std Dev line")
show_upper_quant_std_down = input.bool(true,  "Show Upper Quantile - Std Dev", tooltip="Enable or disable the Upper Quantile - Std Dev line")
show_lower_quant_std_up   = input.bool(false, "Show Lower Quantile + Std Dev", tooltip="Enable or disable the Lower Quantile + Std Dev line")
show_lower_quant_std_down = input.bool(true,  "Show Lower Quantile - Std Dev", tooltip="Enable or disable the Lower Quantile - Std Dev line")

// Moving Average Toggles
show_ema = input.bool(false, "Show EMA", tooltip="Enable or disable the Exponential Moving Average")
show_sma = input.bool(false, "Show SMA", tooltip="Enable or disable the Simple Moving Average")

// EMA Parameters
ema_length = input.int(50, minval=1, title="EMA Length")
ema_source = input.source(close, title="EMA Source")

// === Data Handling ===

// Create persistent arrays to store data
var float[] data_array   = array.new_float()
var float[] return_array = array.new_float()

// Update the data array with the latest close prices
if array.size(data_array) < length
    array.push(data_array, close)
else
    array.shift(data_array)
    array.push(data_array, close)

// Update the return array with the latest returns
returns = close / close[1] - 1
if array.size(return_array) < length
    array.push(return_array, returns)
else
    array.shift(return_array)
    array.push(return_array, returns)

// === Helper Function ===

// Function to calculate a custom percentile
f_percentile(arr, quantile) =>
    arr_sorted = array.copy(arr)
    array.sort(arr_sorted, order.ascending)
    index = math.round((array.size(arr_sorted) - 1) * quantile)
    array.get(arr_sorted, index)

// === Calculations ===

// Bollinger Bands Calculation
sma        = ta.sma(close, length)
stdev      = ta.stdev(close, length)
boll_upper = sma + boll_mult * stdev
boll_lower = sma - boll_mult * stdev

// Power-Law Bands Calculation
var float power_upper = na
var float power_lower = na
if array.size(return_array) == length
    power_upper := f_percentile(return_array, upper_quantile)
    power_lower := f_percentile(return_array, lower_quantile)
var float power_upper_band = na
var float power_lower_band = na
if not na(power_upper) and not na(power_lower)
    power_upper_band := close * (1 + power_upper)
    power_lower_band := close * (1 + power_lower)

// Quantile Bands Calculation
var float quant_upper = na
var float quant_lower = na
if array.size(data_array) == length
    quant_upper := f_percentile(data_array, upper_quantile)
    quant_lower := f_percentile(data_array, lower_quantile)

// Standard Deviation around Quantile Bands
quant_upper_std_up   = quant_upper + stdev
quant_upper_std_down = quant_upper - stdev
quant_lower_std_up   = quant_lower + stdev
quant_lower_std_down = quant_lower - stdev

// === Color Calculations ===

// For the upper Bollinger band, color it yellow when price is above it, black otherwise.
upper_boll_color = close > boll_upper ? color.yellow : color.black

// The entry/exit trigger is based on the lower std dev band of the upper quantile band.
// It "turns green" (i.e. favorable for entry) when the price is above this level,
// and "turns red" (i.e. unfavorable, triggering an exit) when price is below it.
triggerCondition = close > quant_upper_std_down

// For plotting purposes, define the color of the lower std dev band of the upper quantile band:
triggerColor = triggerCondition ? color.green : color.red

// (Other color definitions remain for the additional bands.)
upper_power_color = (not na(power_upper_band) and not na(quant_upper_std_up) and power_upper_band > quant_upper_std_up) ? color.new(#FF00FF, 0) : color.black
upper_quant_color = (not na(quant_upper) and not na(power_upper_band) and power_upper_band > quant_upper) ? color.new(#FFAE00, 0) : color.rgb(50, 50, 50)
upper_quant_std_down_color = (not na(quant_upper_std_down) and close > quant_upper_std_down) ? color.green : color.red
lower_quant_std_down_color = (not na(quant_lower_std_down) and close > quant_lower_std_down) ? color.rgb(24, 113, 0, 44) : color.red
lower_quant_color = (ta.cross(close, quant_lower) or close == quant_lower) ? color.red : color.rgb(0, 238, 255)

// For demonstration, a variable to toggle a color on the Bollinger crossover.
var color upper_quant_std_up_color = color.black
if ta.crossover(close, boll_upper)
    upper_quant_std_up_color := color.yellow
if ta.crossunder(close, boll_upper)
    upper_quant_std_up_color := color.black

// === Confirmation Bars Logic with Separate Counters Based on Trigger Condition ===

// Use the trigger condition (based on the lower std dev band of the upper quantile band)
// for entry/exit confirmation.
var int entryCounter = 0
var int exitCounter  = 0

// When triggerCondition is true (price above quant_upper_std_down) the "green" state holds.
entryCounter := triggerCondition ? entryCounter + 1 : 0
// When triggerCondition is false (price below quant_upper_std_down) the "red" state holds.
exitCounter  := not triggerCondition ? exitCounter + 1 : 0

// === Strategy Orders ===

// Enter long when triggerCondition has been true for at least entry_confirmBars bars and no position is active.
if (entryCounter >= entry_confirmBars) and (strategy.position_size <= 0)
    strategy.entry("Long", strategy.long)

// Exit long when triggerCondition has been false for at least exit_confirmBars bars and a long position is active.
if (exitCounter >= exit_confirmBars) and (strategy.position_size > 0)
    strategy.close("Long")

// === Plotting ===

// Plot Bollinger Bands
plot(show_upper_boll ? boll_upper : na, color=upper_boll_color, title="Bollinger Upper", linewidth=2)
plot(show_lower_boll ? boll_lower : na, color=color.red, title="Bollinger Lower", linewidth=1)

// Plot Power-Law Bands
plot(show_upper_power ? power_upper_band : na, color=upper_power_color, title="Power-Law Upper", linewidth=1)
plot(show_lower_power ? power_lower_band : na, color=color.rgb(255, 59, 248), title="Power-Law Lower", linewidth=1)

// Plot Quantile Bands
plot(show_upper_quant ? quant_upper : na, color=upper_quant_color, title="Quantile Upper", linewidth=1)
plot(show_lower_quant ? quant_lower : na, color=lower_quant_color, title="Quantile Lower", linewidth=1)

// Plot Standard Deviation around Quantile Bands
plot(show_quant_std and show_upper_quant and show_upper_quant_std_up ? quant_upper_std_up : na, color=upper_quant_std_up_color, title="Quantile Upper + Std Dev", linewidth=2)
plot(show_quant_std and show_upper_quant and show_upper_quant_std_down ? quant_upper_std_down : na, color=upper_quant_std_down_color, title="Quantile Upper - Std Dev", linewidth=2)
plot(show_quant_std and show_lower_quant and show_lower_quant_std_up ? quant_lower_std_up : na, color=color.green, title="Quantile Lower + Std Dev", linewidth=1)
plot(show_quant_std and show_lower_quant and show_lower_quant_std_down ? quant_lower_std_down : na, color=lower_quant_std_down_color, title="Quantile Lower - Std Dev", linewidth=1)

// Also plot the trigger line (lower std dev band of upper quantile band) with its own color
plot(show_quant_std ? quant_upper_std_down : na, color=triggerColor, title="Trigger (Lower Std Dev of Upper Quantile)", linewidth=2)

// Plot SMA for reference
plot(show_sma ? sma : na, color=color.rgb(0, 24, 132), title="SMA", linewidth=3)

// Plot EMA for reference
ema_value = ta.ema(ema_source, ema_length)
plot(show_ema ? ema_value : na, color=color.rgb(147, 0, 0), title="EMA", linewidth=2)