マルチレベルEMAとRSIのダイナミックな潜在的強さに基づくビットコインのクロスサイクルトレンド取引戦略

2
Follow
478
Followers
概要
この戦略は,周期間分析に基づくトレンド追跡取引システムで,周線と日線レベルのEMA平均線とRSI指標を組み合わせて,市場の動向と動態を識別する.戦略は,複数の時間枠のトレンド一致性によって取引機会を特定し,ATRベースのダイナミックストップローズを使用してリスクを管理する.システムは,資金管理モデルを採用し,取引ごとに口座の100%の資金を使用し,取引手数料0.1%を考慮する.
戦略原則
戦略の中核となるロジックは、次の主要な要素に基づいています。
- 周回線レベルのEMAを主要トレンドフィルターとして使用し,日線閉盘価格と周回線EMAの関係と組み合わせて市場の状態を決定する
- ATR指数による動的トレンド調整の<unk>値,戦略の適応性を高める
- 追加取引フィルターとしてRSI動量指標を統合する
- 7日間の最低価格とATRに基づくトラッキング・ストップ・システムを使用
- 過剰上昇の警告信号が出たとき,戦略はリスクを回避するためにポジションを一時停止します.
戦略的優位性
- 複数のタイムフレーム分析により,偽のブレイクを効果的にフィルターできる,より包括的な市場見通しが提供されます.
- ダイナミック・ストップ・メカニズムは,市場の波動に自律的に適応し,柔軟なリスク管理を提供します.
- RSI 動力フィルターは,トレンドの強さを確認し,入場品質を向上させます.
- システムには過剰依存症の早期警告機能があり,撤退のリスクを回避できます.
- 戦略のパラメータは,異なる市場状況に応じて最適化するために,調整可能である
戦略リスク
- 横軸市場での頻繁な出入は取引コストの上昇につながる可能性があります.
- 100%の資金で取引する場合は,取り戻しのリスクが高い.
- 市場突発に反応しない技術指標に依存する
- 複数のタイムフレーム解析では,異なるレベルで矛盾するシグナルが発生する可能性があります.
- 追跡停止は,急激な波動で早めに起動される可能性があります.
戦略最適化の方向性
- 波動率フィルターの導入により,低波動期間の取引頻度が減少
- ポジション管理システムを追加し,市場状況に応じてポジション比率を動的に調整する
- 基本指標を統合し,市場環境の判断を追加する
- ストップ・ロスを追跡するパラメータを最適化して,異なる市場段階に適した状態にします.
- トレンド判断の正確さを高めるための取引量分析
要約する
これは,構造が整った,論理が明確なトレンド追跡戦略である.複数のタイムフレームの分析とダイナミックな指標のフィルタリングにより,戦略は主要なトレンドをよりよく捉えることができる.いくつかの固有のリスクがあるものの,パラメータの最適化と補足指標の追加により,戦略には大きな改善の余地がある.実物取引の前に十分な反射を施し,特定の市場環境に応じてパラメータの設定を調整することが推奨されている.
Source
Pine
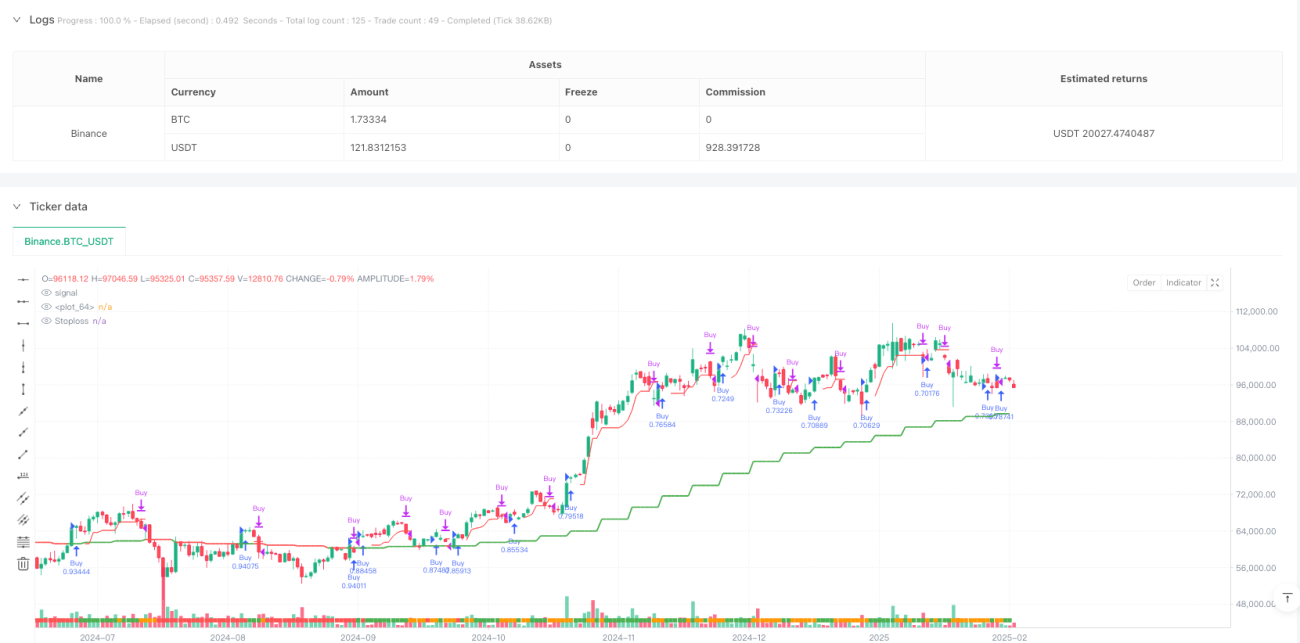
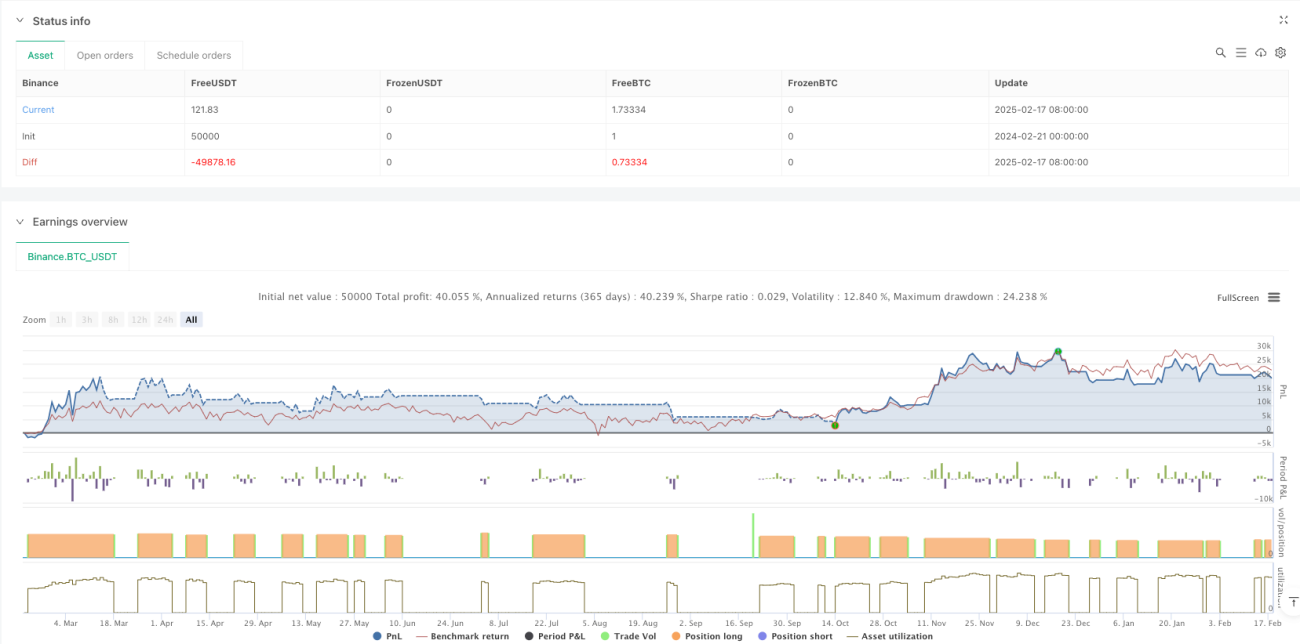
/*backtest
start: 2024-02-21 00:00:00
end: 2025-02-18 08:00:00
period: 1d
basePeriod: 1d
exchanges: [{"eid":"Binance","currency":"BTC_USDT"}]
*/

// @version=6
strategy("Bitcoin Regime Filter Strategy",         // Strategy name
     overlay=true,                                 // The strategy will be drawn directly on the price chart
initial_capital=10000, // Initial capital of 10000 USDStrategy parameters
Related strategies
Comment
All comments (0)
No data
- 1