
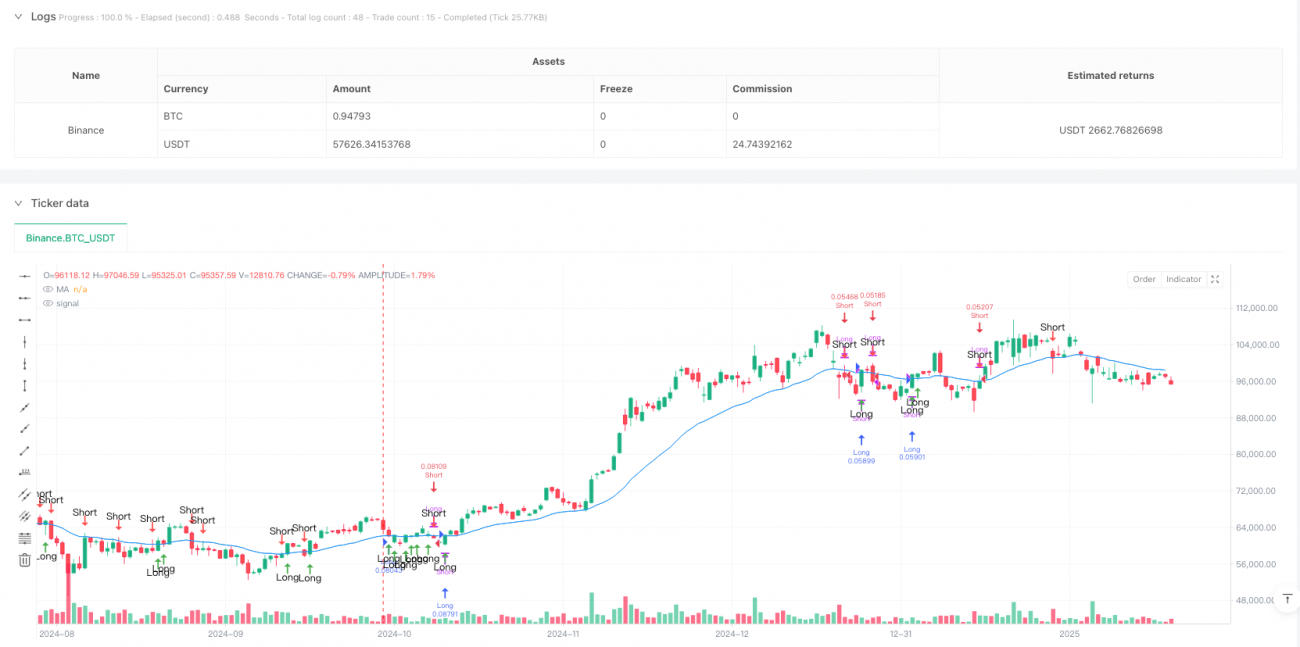
この戦略は,複合平均線に基づくトレンド追跡と反転取引システムである.これは,異なる周期の移動平均を組み合わせて,平均線に対する価格の反応と組み合わせて,取引の機会を識別する.戦略の核心は,価格と平均線との関係を観察し,特定の下落時に価格の反応を判断することによって,取引のタイミングを判断する.
戦略は,複数の移動平均型 (EMA,TEMA,DEMA,WMA,SMA) の組み合わせを使用して,2つの異なる周期 (デフォルト20と30) の加重または算術平均を使って複合平均線を構築する.価格が平均線上にあると上昇傾向とみなされ,平均線下にあると下降傾向とみなされる.戦略は,トレンドが確立された後に価格が平均線近くに戻ることを待つ.
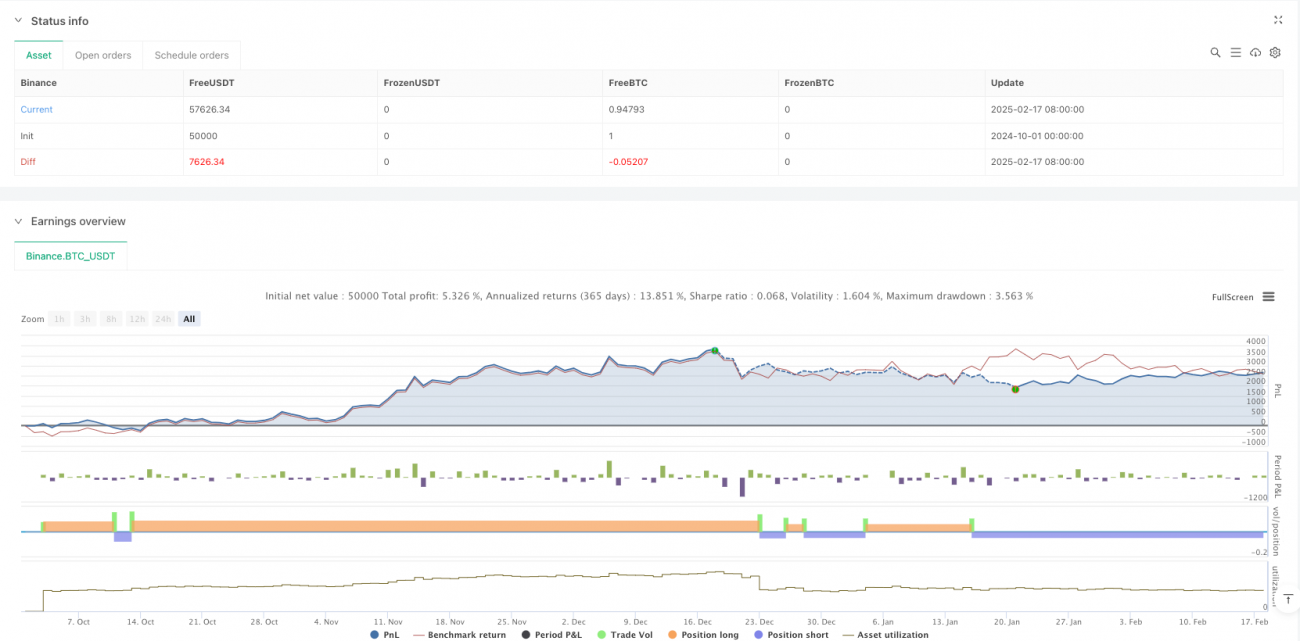
これは,トレンド追跡と反転取引の理念を組み合わせた戦略であり,均線と価格反応の合わさった仕組みによって取引機会を捉える.戦略の核心的な優位性は,その柔軟性と偽信号をフィルターする能力にあるが,同時に,異なる市場環境におけるパラメータ最適化の問題にも注意する必要がある.合理的なリスク制御と継続的な最適化改善により,この戦略は,実際の取引で安定した収益を期待する.
/*backtest
start: 2024-10-01 00:00:00
end: 2025-02-18 08:00:00
period: 1d
basePeriod: 1d
exchanges: [{"eid":"Binance","currency":"BTC_USDT"}]
*/
//@version=5
strategy("Ultrajante MA Reaction Strategy", overlay=true, initial_capital=10000,
default_qty_type=strategy.percent_of_equity, default_qty_value=10)
// ===== Custom Functions for DEMA and TEMA =====
dema(src, length) =>
ema1 = ta.ema(src, length)
ema2 = ta.ema(ema1, length)
2 * ema1 - ema2
tema(src, length) =>
ema1 = ta.ema(src, length)
ema2 = ta.ema(ema1, length)
ema3 = ta.ema(ema2, length)
3 * ema1 - 3 * ema2 + ema3
// ===== Configuration Parameters =====
// MA Type Selection
maType = input.string(title="MA Type", defval="EMA", options=["SMA", "EMA", "WMA", "DEMA", "TEMA"])
// Parameters for composite periods
periodA = input.int(title="Period A", defval=20, minval=1)
periodB = input.int(title="Period B", defval=30, minval=1)
compMethod = input.string(title="Composite Method", defval="Average", options=["Average", "Weighted"])
// Reaction percentage (e.g., 0.5 means 0.5%)
reactionPerc = input.float(title="Reaction %", defval=0.5, step=0.1)
// ===== Composite Period Calculation =====
compPeriod = compMethod == "Average" ? math.round((periodA + periodB) / 2) : math.round((periodA * 0.6 + periodB * 0.4))
// ===== Moving Average Calculation based on selected type =====
ma = switch maType
"SMA" => ta.sma(close, compPeriod)
"EMA" => ta.ema(close, compPeriod)
"WMA" => ta.wma(close, compPeriod)
"DEMA" => dema(close, compPeriod)
"TEMA" => tema(close, compPeriod)
=> ta.ema(close, compPeriod) // Default value
plot(ma, color=color.blue, title="MA")
// ===== Trend Definition =====
trendUp = close > ma
trendDown = close < ma
// ===== Reaction Threshold Calculation =====
// In uptrend: expect the price to retrace to or below a value close to the MA
upThreshold = ma * (1 - reactionPerc / 100)
// In downtrend: expect the price to retrace to or above a value close to the MA
downThreshold = ma * (1 + reactionPerc / 100)
// ===== Quick Reaction Detection =====
// For uptrend: reaction is detected if the low is less than or equal to the threshold and the close recovers and stays above the MA
upReaction = trendUp and (low <= upThreshold) and (close > ma)
// For downtrend: reaction is detected if the high is greater than or equal to the threshold and the close stays below the MA
downReaction = trendDown and (high >= downThreshold) and (close < ma)
// ===== Trade Execution =====
if upReaction
// Close short position if exists and open long position
strategy.close("Short", comment="Close Short due to Bullish Reaction")
strategy.entry("Long", strategy.long, comment="Long Entry due to Bullish Reaction in Uptrend")
if downReaction
// Close long position if exists and open short position
strategy.close("Long", comment="Close Long due to Bearish Reaction")
strategy.entry("Short", strategy.short, comment="Short Entry due to Bearish Reaction in Downtrend")
// ===== Visualization of Reactions on the Chart =====
plotshape(upReaction, title="Bullish Reaction", style=shape.arrowup, location=location.belowbar, color=color.green, size=size.small, text="Long")
plotshape(downReaction, title="Bearish Reaction", style=shape.arrowdown, location=location.abovebar, color=color.red, size=size.small, text="Short")