マルチレベルRSIクロス回帰戦略

2
Follow
478
Followers
概要
この戦略は,比較的強い指標 ((RSI)) に基づく自動化された取引システムで,主要的には市場の過売り条件を識別することによって潜在的な反弹の機会を捕捉する.この戦略は,RSIの低値交差時に段階的に複数のポジションを確立し,収益目標を設定することによってリスク管理を行う漸進的なポジション構築を採用する.システムは,柔軟な資金管理機構を設計し,取引ごとに口座総額の6.6%を使用し,最大15回のピラミッド加減を許可する.
戦略原則
戦略の中核となるロジックは、次の主要な要素に基づいています。
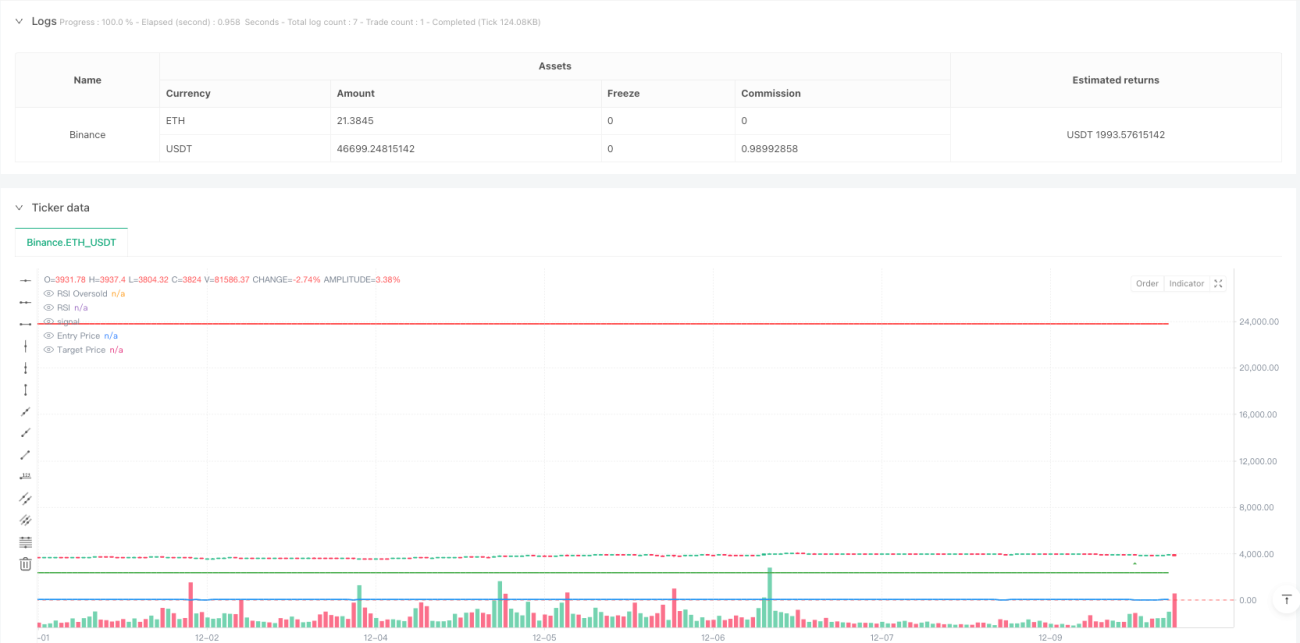
- 入場シグナル:14サイクルRSIの下の28.5の超売りレベルを突破すると,買取シグナルをトリガーする
- ポジション管理:一度の倉庫建設は,使用口座の権利利得の6.6%で,最大15回の倉庫建設が許可されています.
- 利益の結末: 価格が建物の平均価格の900%の上昇に達すると,50%の保有額を撤回する
- 視覚表示: グラフに,買出シグナル,RSI曲線,入場価格,ターゲット価格を表示する
戦略は,RSI指標が超売り地域でのパフォーマンスを観察して市場の動きを判断し,超売りシグナルが発生したときに段階的に仓庫を建設し,倉庫建設コストを削減する.
戦略的優位性
- 体系的なポジション構築: 既定のRSIパラメータで取引機会を自動的に識別し,人為的な判断による主観的偏差を回避する
- リスク分散: 順次的なポジション構築方法を使用して,異なる価格で複数のポジションを確立し,リスクを効果的に分散する
- 柔軟な適応: 戦略のパラメータは,異なる市場環境と個人のリスクの好みに応じて調整できます
- 利益保護:明確な利益目標が設定され,目標に達すると自動的に減仓され,利益の一部がロックされます.
- 資金効率:合理的なポジション管理と加仓メカニズムによって資金使用の効率を向上させる
戦略リスク
- トレンドリスク: 強い下落のトレンドでは,しばしばポジションのシグナルを誘発し,資金の損失を引き起こす可能性があります.
- パラメータに敏感である:RSIパラメータ,ポジション構築比率などの不適切な設定は,戦略のパフォーマンスを影響する可能性がある
- 市場流動性: 流動性の低い市場では,目標価格で取引を完了することが困難である
- 資金管理:過剰な投資はリスクの拡大につながる
解決:
- トレンドフィルターを追加し,明確な下落傾向で倉庫建設を一時停止する
- 回測による最適化パラメータ設定
- 設定する最大撤回制限
- 動的調整加減値
戦略最適化の方向性
- ダイナミックパラメータ:市場の変動に応じてRSIパラメータとポジションの条件を自動的に調整する
- リスク管理のためのモバイル・ストップ機能の追加
- 市場フィルター:取引量,トレンドなどのフィルタリング条件を追加し,信号の質を向上させる
- 出場最適化:分期減仓などのより柔軟な収益化メカニズムを設計する
- リスク管理:最大撤回制限とリスク口管理の強化
要約する
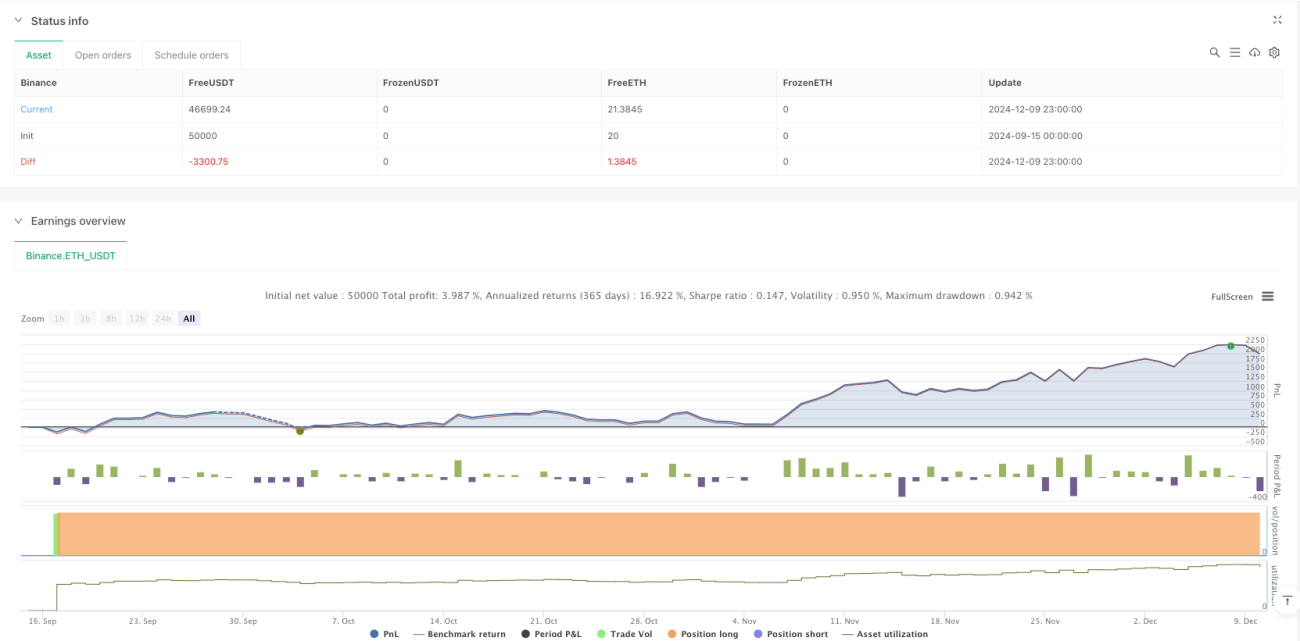
この戦略は,RSI指標による超売り機会を特定し,ピラミッド式加仓と固定比率を組み合わせて利潤を結び,完全な取引システムを構築した.戦略の優点は,システム化された操作とリスク分散にあるが,市場動向とパラメータ設定が戦略のパフォーマンスに与える影響に注意する必要がある.ダイナミックなパラメータ調整,ストップダスト機構,市場フィルターなどの最適化措置を追加することで,戦略の安定性と収益性をさらに向上させることができる.
Source
Pine
/*backtest
start: 2024-09-15 00:00:00
end: 2024-12-10 00:00:00
period: 1h
basePeriod: 1h
exchanges: [{"eid":"Binance","currency":"ETH_USDT"}]
*/

//@version=5
strategy("RSI Cross Under Strategy", overlay=true, initial_capital=1500, default_qty_type=strategy.percent_of_equity, default_qty_value=6.6)

// Input parametersStrategy parameters
Related strategies
Comment
All comments (0)
No data
- 1