ナダラヤ・ワトソンに基づく多次元統合取引戦略

2
Follow
478
Followers
概要
この戦略は,Nadaraya-Watson核帰帰をベースとする多次元取引システムで,技術,感情,超感性,および意向の4つの次元を統合した市場情報を集約し,総合的な信号を形成して取引決定を導く.戦略は,重量最適化方法を採用し,異なる次元の信号を重量処理し,信号品質を向上させるためにトレンドと動量フィルターを組み合わせている.システムには,損失の停止と止まりによって資金の安全性を保護する完全なリスク管理モジュールも含まれている.
戦略原則
戦略の核心は,Nadaraya-Watson核帰帰法による多次元市場データの平滑処理である.具体的には:
- 技術的側面の使用収束価格
- 感情の次元はRSI指標を用いて
- 超感度次元はATR波動率を使用
- 意向次元使用価格と平均線偏差
これらの次元は,核回帰を平滑化した後,前置の重量 ((技術0.4,感情0.2,超感触0.2,意向0.2) を加重統合し,最終的な取引信号を形成する. 統合信号が移動平均と交差したとき,トレンドと運動量フィルターの確認と組み合わせて取引指示を発行する.
戦略的優位性
- 多次元分析は,単一の指標の限界を回避し,より包括的な市場視点を提供します.
- Nadaraya-Watsonの核帰帰化は,市場騒音を効率的に減らし,よりスムーズな信号を提供する.
- 重量最適化メカニズムは,市場の特徴に応じて各次元の重要性を調整することを可能にします.
- トレンドとモーターフィルターの追加により,信号の質が著しく向上しました.
- 健全なリスク管理システムにより 資金の安全性を確保
戦略リスク
- 過度なパラメータ最適化は過剰適合につながる可能性がある
- 複数のフィルタリング条件が有効な信号の一部を逃している可能性があります.
- 核回帰計算は複雑で,リアルタイム性能に影響を与える可能性がある.
- 市場における重要なシグナルを弱体化させる可能性がある
緩和策には,サンプル外テスト検証パラメータを使用し,フィルタリング条件を動的に調整し,計算効率を最適化し,定期的に評価し,重量配分を調整するなどがあります.
戦略最適化の方向性
- 市場状況の動向に応じて各次元の重量を調整する自己適応重量システム
- 信号の質と量をバランスするよりスマートなフィルタリングメカニズムを開発する
- Nadaraya-Watsonアルゴリズムの実装を最適化し,計算効率を向上させる
- 市場周期認識モジュールに追加し,異なる市場段階で異なるパラメータ設定を使用
- リスク管理システムの拡張,ダイナミック・ストップ・ローズとポジション管理機能の追加
要約する
これは,数学的な方法と取引の知性を組み合わせた革新的な戦略である. 多次元分析と高度な数学ツールによって,戦略は市場の複数の層を捉え,比較的信頼性の高い取引信号を提供することができる. いくつかの最適化の余地があるが,戦略の全体的な枠組みは,実用的な応用価値を持つ堅牢である.
Source
Pine
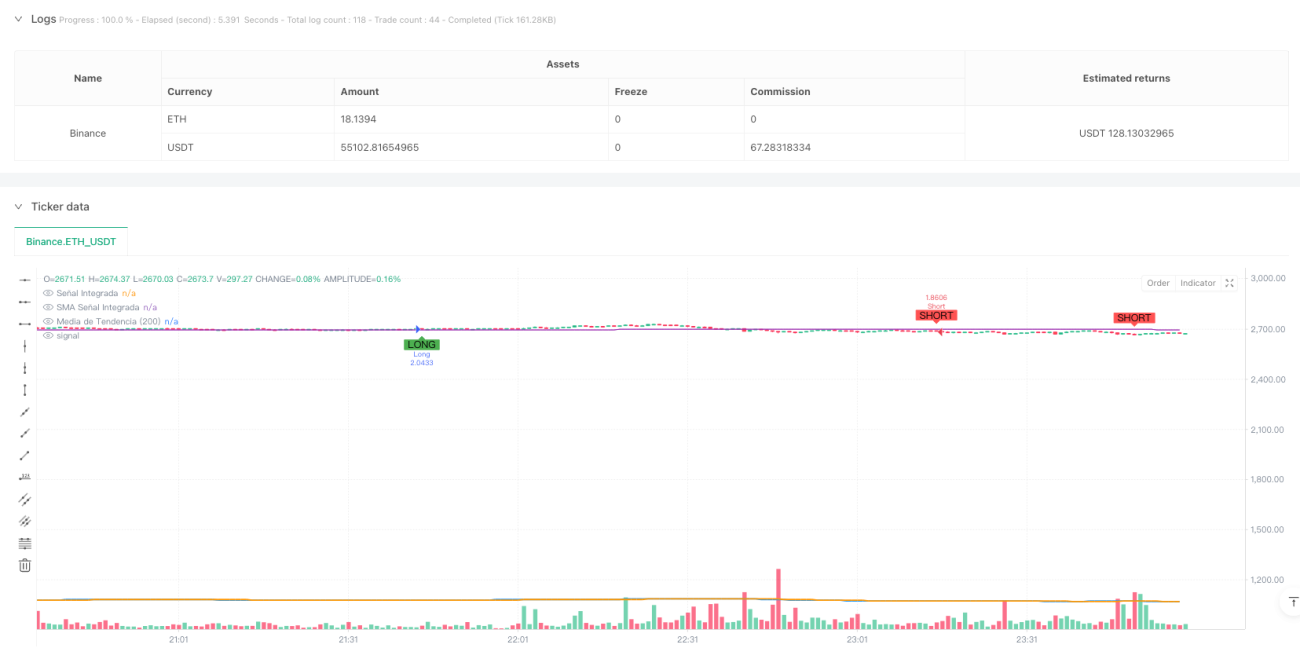
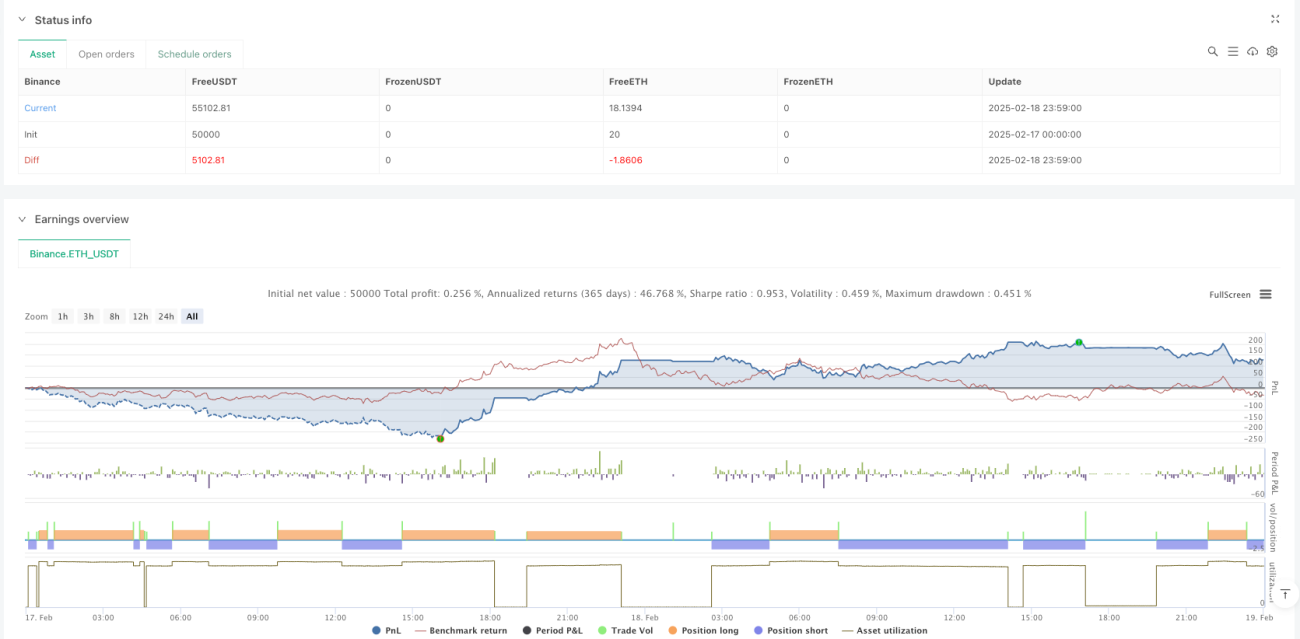
/*backtest
start: 2025-02-17 00:00:00
end: 2025-02-19 00:00:00
period: 1m
basePeriod: 1m
exchanges: [{"eid":"Binance","currency":"ETH_USDT"}]
*/

//@version=5
strategy("Enhanced Multidimensional Integration Strategy with Nadaraya", overlay=true, initial_capital=10000, currency=currency.USD, default_qty_type=strategy.percent_of_equity, default_qty_value=10)

//────────────────────────────────────────────────────────────────────────────Strategy parameters
Related strategies
Comment
All comments (0)
No data
- 1