MACDヒストグラムに基づくモメンタムダイバージェンストレンド反転定量戦略

2
Follow
478
Followers
概要
この戦略は,MACD柱状図の動量から逸脱したトレンド反転取引システムである.K線形の変化とMACD柱状図の動量変化の関係を解析することによって,市場の反転信号を捉える.戦略の核心思想は,市場の動量衰退の兆候があるときに反転取引を行うことであり,その結果,トレンドが反転しようとしているときに前もって配置する.
戦略原則
この戦略の取引論理は,空白と多額の2つの方向に分かれています.
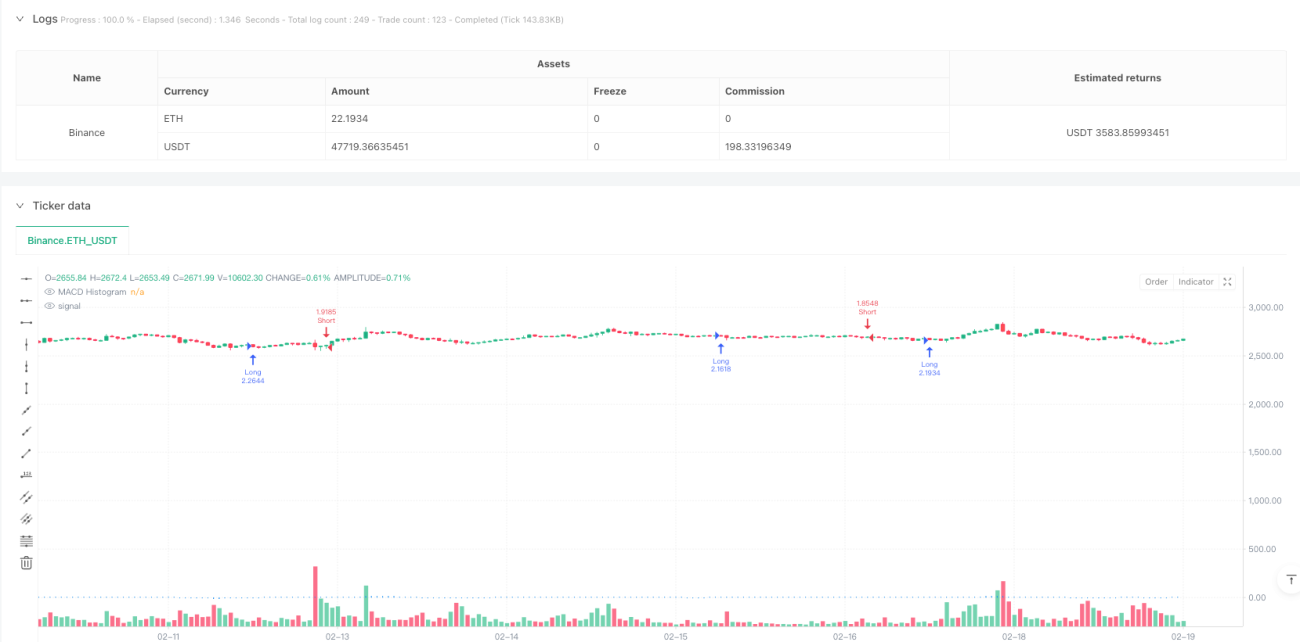
空白条件:大きな陽線 (閉盤価格が開盤価格より高い) が出現し,その実体は前K線より大きく,またMACD柱状図が3連期の連続で下降傾向を示しているとき,上振動力が弱まっていることを示し,システムは空白信号を発する.
多条件化:大きな陰線 (閉盤価格が開盤価格より低い) が出現し,その実体は前K線より大きく,MACD柱状図が3連期の連続で上昇傾向を示しているとき,下落の動きが弱まっていることを示し,システムは多信号を発する.
持仓管理は,対抗信号平仓メカニズムを採用し,すなわち,逆の方向の取引信号が発生したときに,現在の持仓を平らげる. 戦略は,止損と停止を設定せず,完全に信号に依存してポジションを管理する.
戦略的優位性
- 信号明晰:戦略は,K線形状と技術指標を同時に考慮し,より信頼できる取引信号を提供します.
- 逆転キャプチャ: 変動をモニタリングすることで,市場の転換点を早期に発見できる.
- リスク管理:対抗シグナル平仓メカニズムを使用し,トレンドが変化したときに不利なポジションを継続することを避ける.
- 操作の簡素さ:取引規則は明確で,実行し,反省しやすい.
- 適応性:戦略は異なる市場と時間周期に適用できます.
戦略リスク
- 偽のブレイクリスク: 市場が偽のブレイクを起こし,誤ったシグナルを引き起こす可能性があります.
- 振動市場のリスク:横軸振動市場の場合,頻繁にトレンド転換が連続的なストップ損失を引き起こす可能性があります.
- スライドポイントのリスク: 流動性が不足している場合,大額取引は顕著なスライドポイントに直面する可能性があります.
- 過剰取引のリスク: 信号が頻繁になり,取引コストが高くなる可能性があります.
- 市場環境依存:戦略はトレンド市場ではうまく機能するが,他の市場環境ではうまく機能しない.
戦略最適化の方向性
- トレンドフィルター導入: 均線システムなどのトレンド判断指標を追加し,波動市場における偽信号をフィルタリングする.
- 最適化したストップ・メカニズム:合理的なストップ・ポジションを設定し,単一のリスクを制御する.
- ストップメカニズムの改善:市場変動の動向に応じて利益の結末点の調整.
- 取引のフィルタリング条件を増やす:取引量確認,波動率フィルタリングなど,信号の質を向上させる.
- ポジション管理の最適化:市場状況に応じてポジション保持比率を調整するダイナミックなポジション管理メカニズムを導入する.
要約する
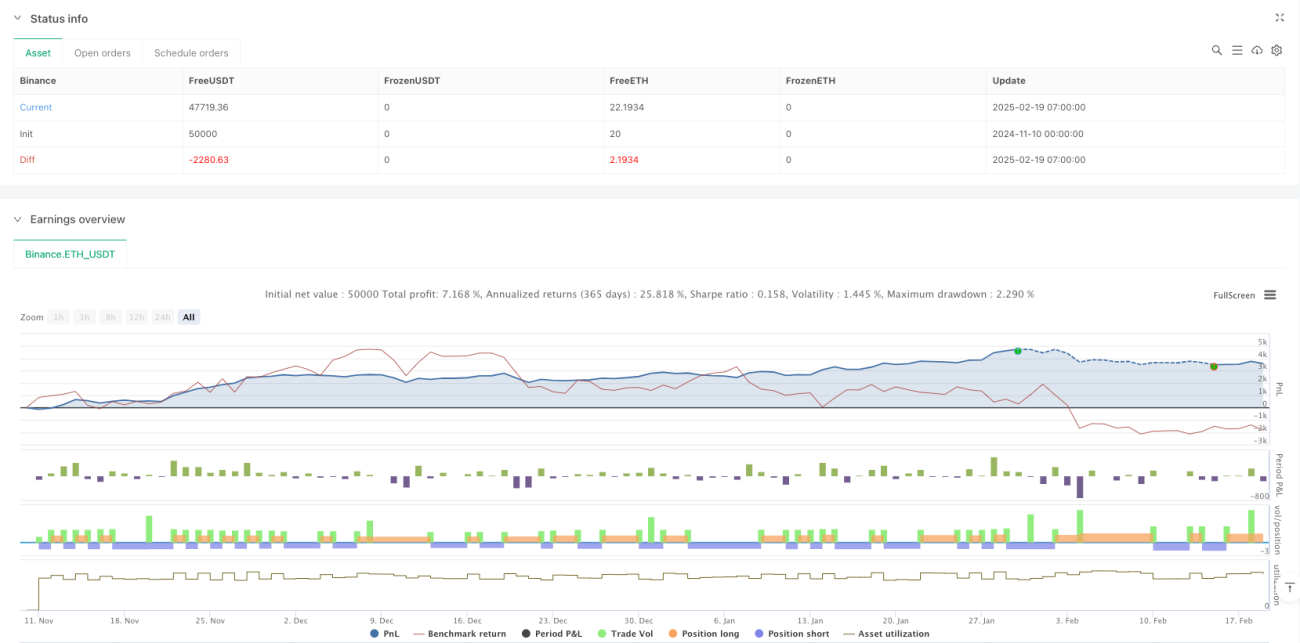
この戦略は,K線形とMACD柱状の動量変化を組み合わせて市場の逆転機会を捕捉し,操作の簡潔さ,信号の明瞭性の特徴を有する.一定のリスクがあるものの,合理的な最適化とリスク管理措置によって,戦略の安定性と収益性を大幅に向上させることができる.戦略は,傾向が顕著な市場環境に特に適しており,取引システムの重要な構成要素として使用できる.
Source
Pine
/*backtest
start: 2024-11-10 00:00:00
end: 2025-02-19 08:00:00
period: 1h
basePeriod: 1h
exchanges: [{"eid":"Binance","currency":"ETH_USDT"}]
*/

//@version=5
strategy("MACD Momentum Reversal Strategy", overlay=true, initial_capital=100000, default_qty_type=strategy.percent_of_equity, default_qty_value=10)

// === MACD Calculation ===Strategy parameters
Comment
All comments (0)
No data
- 1