
2
Follow
478
Followers
概要
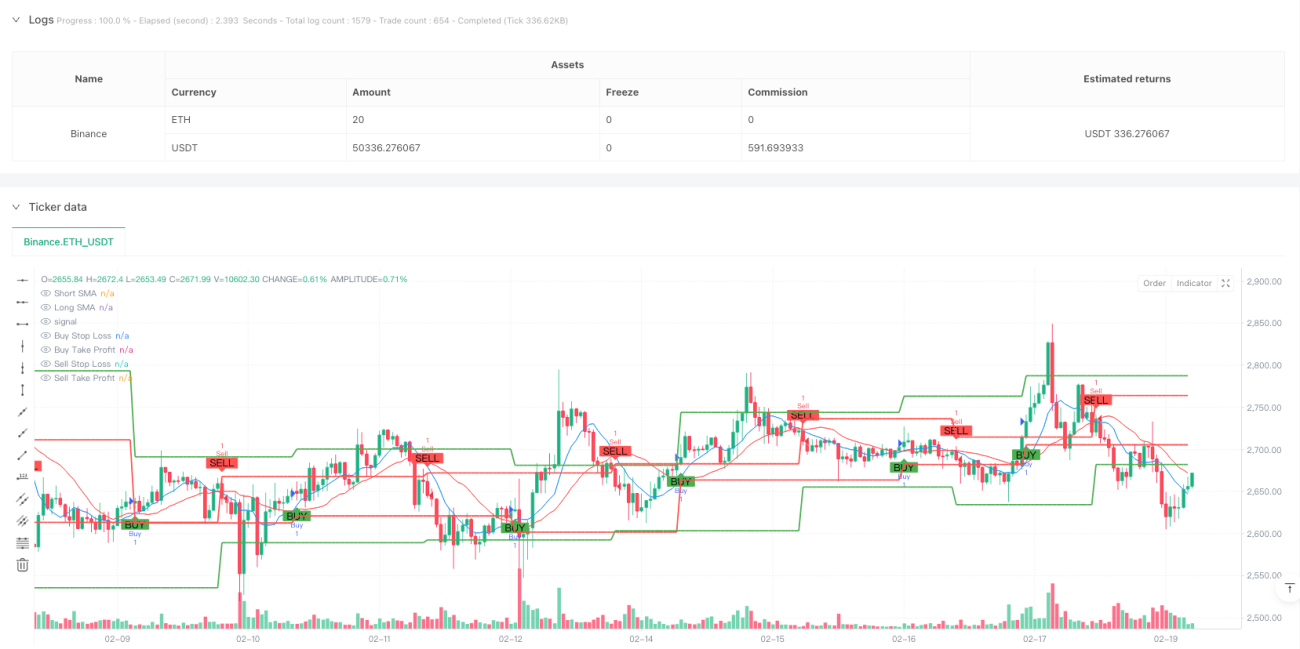
これは,二均線交差信号に基づくスマート取引システムで,リスク管理機能が組み込まれている. システムは,短期および長期のシンプル移動平均 ((SMA)) を使って取引信号を生成し,同時に,リスク管理のためのストップ・ロスとストップ・ストップ機能を統合している. この戦略は,口座資金の動向に応じてポジションの規模を調整するパーセントリスク管理方法を採用し,取引プロセスの自動化とインテリジェンスを実現している.
戦略原則
戦略は以下の基本原則に基づいています.
- 9日と21日の2つの単純な移動平均 ((SMA)) の交差を用いて市場トレンドを捉える.短期平均線が長期平均線を上方から横切るとき,多行シグナルを生成し,短期平均線が長期平均線を下方から横切るとき,空白シグナルを生成する.
- 口座権益に基づくダイナミックなリスク管理システムを使用する.各取引のリスク額は,口座権益の1%に固定され,ストップロスは入場価格の1%に設定され,ストップロスはストップロスの距離の2倍に設定される.
- 戦略は取引規模を自動的に計算し,各取引のリスク金額が常に設定されたレベルにとどまるようにします.
戦略的優位性
- 信号システムはシンプルで信頼性があります.従来型の双均線交差系を使用し,理解し,維持するのが簡単です.
- 優れたリスク管理: ストップ・ロズとストップ・ストップの機能が統合され,取引ごとに最大損失を制限します.
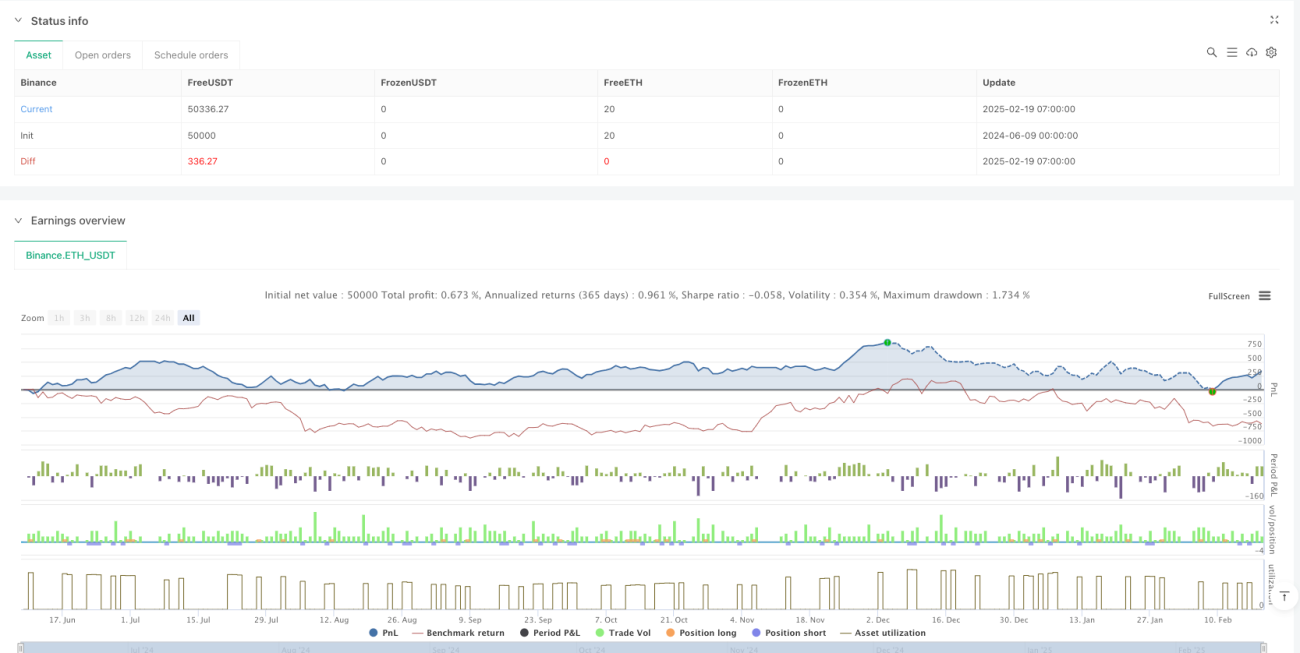
- ダイナミック・ホールディング・マネジメント:口座権益に応じて取引規模を自動的に調整し,固定金額取引によるリスクを回避する.
- 視覚効果:取引信号,ストップ・ロズ,ストップ・ストップのレベルをグラフで明確に表示し,監視と分析を容易にします.
- パラメータの調整性:主要なパラメータは,入力インターフェースで調整され,異なる市場環境に対応できます.
戦略リスク
- 振動市場のリスク:横盤振動の状況では,偽の突破シグナルが頻繁に発生し,連続したストップ損失を引き起こす可能性があります.
- スリップポイントリスク:市場が激しく波動する時には,実際の取引価格と理論価格の大きな偏差がある可能性があります.
- システムリスク: 市場が飛躍したり,重大事件が起きたときに,ストップ・ロスは失効する可能性がある.
- パラメータ最適化のリスク: パラメータを過度に最適化すると,実盤での戦略の不良なパフォーマンスを引き起こす可能性があります.
戦略最適化の方向性
- トレンドフィルターを追加: ADXなどのトレンド指標を追加し,強いトレンド状況下で取引を行う.
- 損失を最適化する方法:変動率を自律的に適応した動的損失を考慮して,損失の柔軟性を向上させることができる.
- 取引量指標の導入: 取引量分析を組み合わせて,取引信号の信頼性を向上させる.
- タイムフィルターを追加: 波動が大きい開盤と閉盤の時期に取引を避ける.
- 撤回制御の追加:最大撤回制限を設定し,損失が特定のレベルに達すると自動的に取引を停止する.
要約する
これは,クラシックな技術分析方法と近代的なリスク管理理念を組み合わせたスマート取引システムである. 動的リスク管理を利用してトレンドの自動化を実行する. システムのいくつかの最適化が必要な場所があるが,全体的な設計理念は先端で,優れた実用価値を有している. 取引者は,実地での使用の前に充分にテストし,特定の市場特性に応じてターゲットに最適化することを推奨する.
Source
Pine
Strategy parameters
Related strategies
Comment
All comments (0)
No data
- 1