
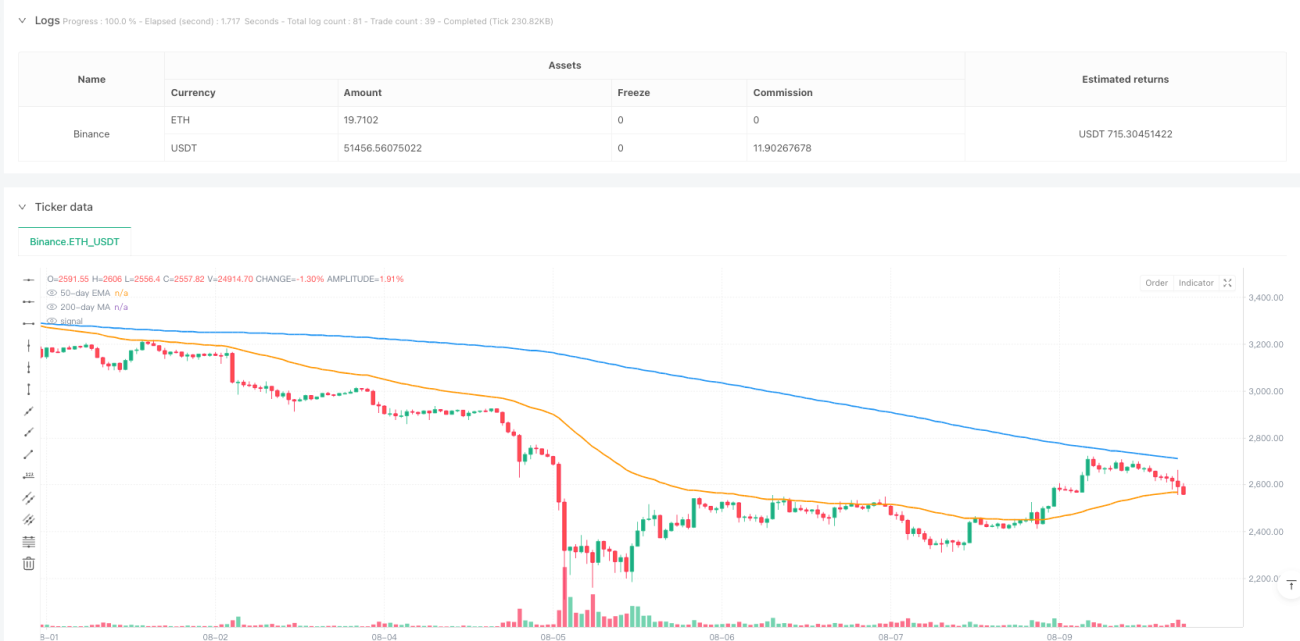
この戦略は,複数の技術指標を組み合わせたトレンド追跡量取引システムである.これは,主に200日移動平均 ((MA200) を使って大トレンドの方向性を判断し,50日指数移動平均 ((EMA50) を使って反動の機会を識別し,相対的に強い指標 ((RSI)) と移動平均のトレンド散度 ((MACD)) の交差信号を組み合わせて,入場のタイミングを決定する.この戦略には,リスクコントロールの仕組みが含まれ,リスクの利益率と追跡を設定することで利潤を保護する.
戦略の核心的な論理は,多層のフィルターメカニズムによって取引の正確性を向上させることである.まずは,MA200によって市場主動トレンドを決定し,価格がMA200以上であるときは多頭トレンドと判断され,逆は空頭トレンドである.トレンドの方向を決定した後,戦略は,価格が最近5サイクルでEMA50を触ったことを要求するEMA50の近くの反転の機会を探し,同時に,RSI指標を使用して動き量を確認し,多頭トレンドではRSIが50より大きいことを要求し,空頭トレンドではRSIが50より小さいことを要求する.最後に,MACDゴールドフォークを特定の入場場として使用する.
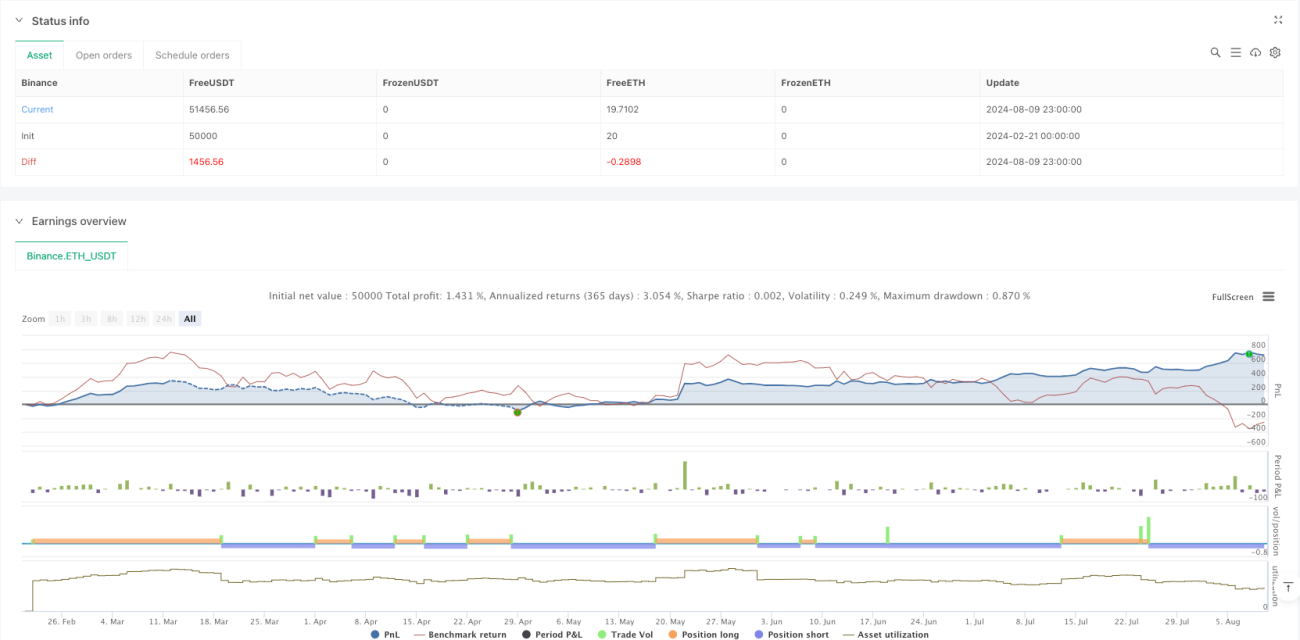
この戦略は,複数の技術指標を統合して,トレンドを追跡する完全な取引システムを構築している.この戦略の優点は,複数のシグナルが取引の信頼性を高め,リスク管理機構は戦略に優れた保護を提供していることである.いくつかの固有のリスクがあるにもかかわらず,推奨された最適化の方向によって戦略のパフォーマンスをさらに向上させることができる.全体的に,これは論理的に厳格で実用的な強力な量化取引戦略である.
/*backtest
start: 2024-02-21 00:00:00
end: 2024-08-10 00:00:00
period: 1h
basePeriod: 1h
exchanges: [{"eid":"Binance","currency":"ETH_USDT"}]
*/
//@version=6
strategy("Trend-Following Momentum Strategy", overlay=true, default_qty_type=strategy.percent_of_equity, default_qty_value=2)
// PARAMETERS
lengthMA200 = input(200, title="200-day MA Length")
lengthEMA50 = input(50, title="50-day EMA Length")
rsiLength = input(14, title="RSI Length")
macdFastLength = input(12, title="MACD Fast Length")
macdSlowLength = input(26, title="MACD Slow Length")
macdSignalLength = input(9, title="MACD Signal Length")
riskRewardRatio = input(1.5, title="Risk-Reward Ratio")
useTrailingStop = input(true, title="Use Trailing Stop?")
trailingPercent = input(1.0, title="Trailing Stop (%)") / 100
// INDICATORS
ma200 = ta.sma(close, lengthMA200) // 200-day MA
ema50 = ta.ema(close, lengthEMA50) // 50-day EMA
rsi = ta.rsi(close, rsiLength) // RSI
[macdLine, signalLine, _] = ta.macd(close, macdFastLength, macdSlowLength, macdSignalLength)
// TREND CONDITIONS
bullishTrend = close > ma200
bearishTrend = close < ma200
// PULLBACK CONDITION
recentPullbackLong = ta.barssince(close < ema50) < 5 // Price touched EMA50 in last 5 bars
recentPullbackShort = ta.barssince(close > ema50) < 5 // Price touched EMA50 in last 5 bars
// ENTRY CONDITIONS
longEntry = bullishTrend and ta.crossover(macdLine, signalLine) and rsi > 50 and recentPullbackLong
shortEntry = bearishTrend and ta.crossunder(macdLine, signalLine) and rsi < 50 and recentPullbackShort
// EXECUTE TRADES
if longEntry
strategy.entry("Long", strategy.long)
strategy.exit("Long Exit", from_entry="Long", limit=close * (1 + riskRewardRatio), stop=close * (1 - (1 / (1 + riskRewardRatio))), trail_price=useTrailingStop ? close * (1 - trailingPercent) : na)
if shortEntry
strategy.entry("Short", strategy.short)
strategy.exit("Short Exit", from_entry="Short", limit=close * (1 - riskRewardRatio), stop=close * (1 + (1 / (1 + riskRewardRatio))), trail_price=useTrailingStop ? close * (1 + trailingPercent) : na)
// PLOT INDICATORS
plot(ma200, title="200-day MA", color=color.blue, linewidth=2)
plot(ema50, title="50-day EMA", color=color.orange, linewidth=2)