
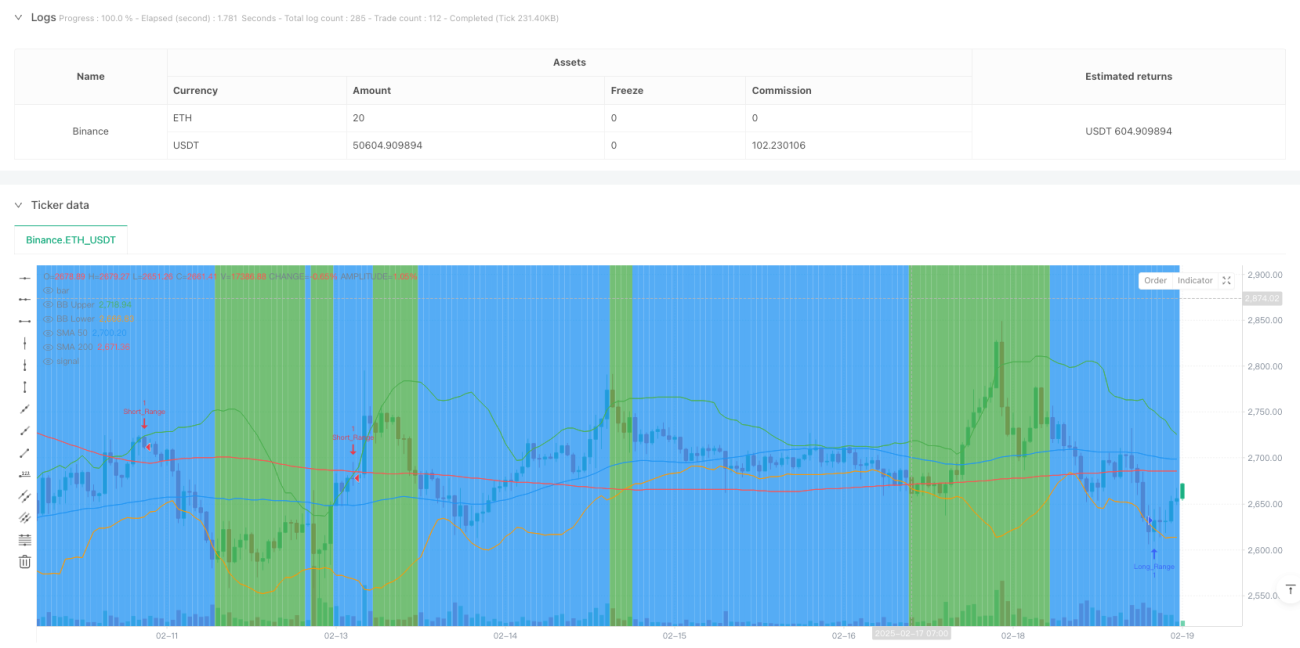
この戦略は,トレンド追跡と区間取引を組み合わせた自己適応的取引システムである.システムは,ADX指標を通じて市場の動態を認識し,トレンド市場と震動市場においてそれぞれ異なる取引戦略を採用する.トレンド市場において,戦略は,RSIとMACDの確認を組み合わせた移動平均クロスシグナルを使用し,震動市場において,戦略は,RSIとオーバーバイオーバーセールシグナルを組み合わせたブリンベルトの突破を利用して取引システムを行う.また,ATRベースのダイナミックストップ・ストップ・メカニズムを統合し,リスクを効果的に制御する.
戦略の核心は,市場状態の識別機構である.ADXが25より大きいときにトレンド市場と判断され,その時にトレンド追跡戦略を有効にする:
ADX が 25 未満で震動市場と判断されたとき,区間取引戦略を有効にします.
止損ストップの設定はATRの動的倍数方式を採用し,止損は1.5倍ATR,止損は3倍ATRである.
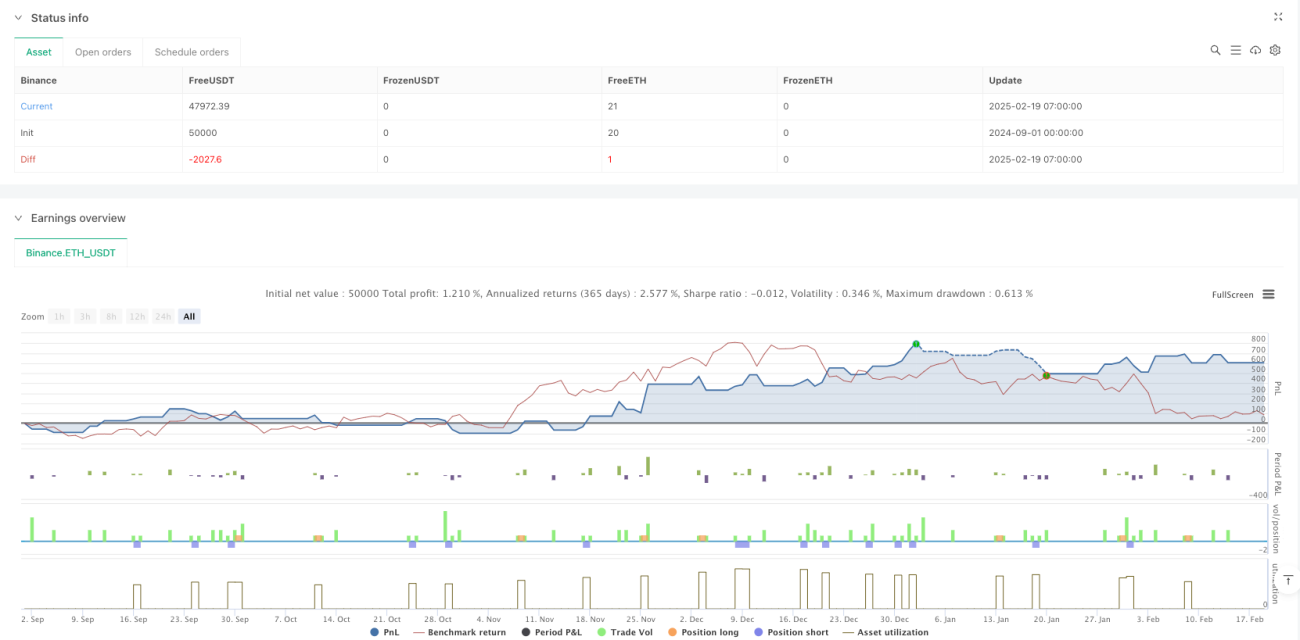
この戦略は,市場状態の動的識別と相応の戦略切替によって,異なる市場環境への適応を実現している.複数の技術指標の配合と動的リスク管理機構により,戦略は優れた実用性を持っている.しかしながら,シグナル遅滞や偽突破などのリスクに注意する必要がある.実場で十分なテストとパラメータの最適化を行うことを推奨する.
/*backtest
start: 2024-09-01 00:00:00
end: 2025-02-19 08:00:00
period: 1h
basePeriod: 1h
exchanges: [{"eid":"Binance","currency":"ETH_USDT"}]
*/
//@version=6
strategy("Trend vs Range Trading - Fully Fixed for v6", overlay=true)
// 🔹 Moving Averages (SMA 50 & 200)
sma50 = ta.sma(close, 50)
sma200 = ta.sma(close, 200)
// 🔹 Proper ADX Calculation (With Corrected ta.dmi() Parameters)
dmiLength = 14
adxSmoothing = 14
[dmiPlus, dmiMinus, adx] = ta.dmi(dmiLength, adxSmoothing)
// 🔹 Bollinger Bands Calculation (Fixed for v6)
bb_length = 20
bb_mult = 2.0
bb_basis = ta.sma(close, bb_length)
bb_dev = ta.stdev(close, bb_length)
bb_upper = bb_basis + (bb_mult * bb_dev)
bb_lower = bb_basis - (bb_mult * bb_dev)
// 🔹 Additional Indicators (RSI & MACD)
rsi = ta.rsi(close, 14)
[macdLine, signalLine, _] = ta.macd(close, 12, 26, 9)
// 🔹 ATR for Stop Loss & Take Profit
atr = ta.atr(14)
stop_loss_mult = 1.5 // Stop Loss Multiplier
take_profit_mult = 3.0 // Take Profit Multiplier
// 🔹 Trend vs Range Market Detection
is_trending = adx > 25
// 🔹 Trend Following Strategy (SMA Cross & Confirmation)
long_condition_trend = is_trending and ta.crossover(sma50, sma200) and rsi > 50 and macdLine > signalLine
short_condition_trend = is_trending and ta.crossunder(sma50, sma200) and rsi < 50 and macdLine < signalLine
// 🔹 Range Trading Strategy (Bollinger Bands & RSI Confirmation)
long_condition_range = not is_trending and ta.crossover(close, bb_lower) and rsi < 40
short_condition_range = not is_trending and ta.crossunder(close, bb_upper) and rsi > 60
// 🔹 Stop Loss & Take Profit Calculations
long_stop_loss = close - (atr * stop_loss_mult)
long_take_profit = close + (atr * take_profit_mult)
short_stop_loss = close + (atr * stop_loss_mult)
short_take_profit = close - (atr * take_profit_mult)
// 🔹 Execute Trades (With Stop Loss & Take Profit)
if long_condition_trend
strategy.entry("Long_Trend", strategy.long)
strategy.exit("Exit_Long_Trend", from_entry="Long_Trend", stop=long_stop_loss, limit=long_take_profit)
if short_condition_trend
strategy.entry("Short_Trend", strategy.short)
strategy.exit("Exit_Short_Trend", from_entry="Short_Trend", stop=short_stop_loss, limit=short_take_profit)
if long_condition_range
strategy.entry("Long_Range", strategy.long)
strategy.exit("Exit_Long_Range", from_entry="Long_Range", stop=long_stop_loss, limit=long_take_profit)
if short_condition_range
strategy.entry("Short_Range", strategy.short)
strategy.exit("Exit_Short_Range", from_entry="Short_Range", stop=short_stop_loss, limit=short_take_profit)
// 🔹 Visual Indicators & Background Color (Trend vs Range)
bgcolor(is_trending ? color.green : color.blue)
// 🔹 Plot Moving Averages & Bollinger Bands
plot(sma50, color=color.blue, title="SMA 50")
plot(sma200, color=color.red, title="SMA 200")
plot(bb_upper, color=color.green, title="BB Upper")
plot(bb_lower, color=color.orange, title="BB Lower")