
2
Follow
478
Followers
概要
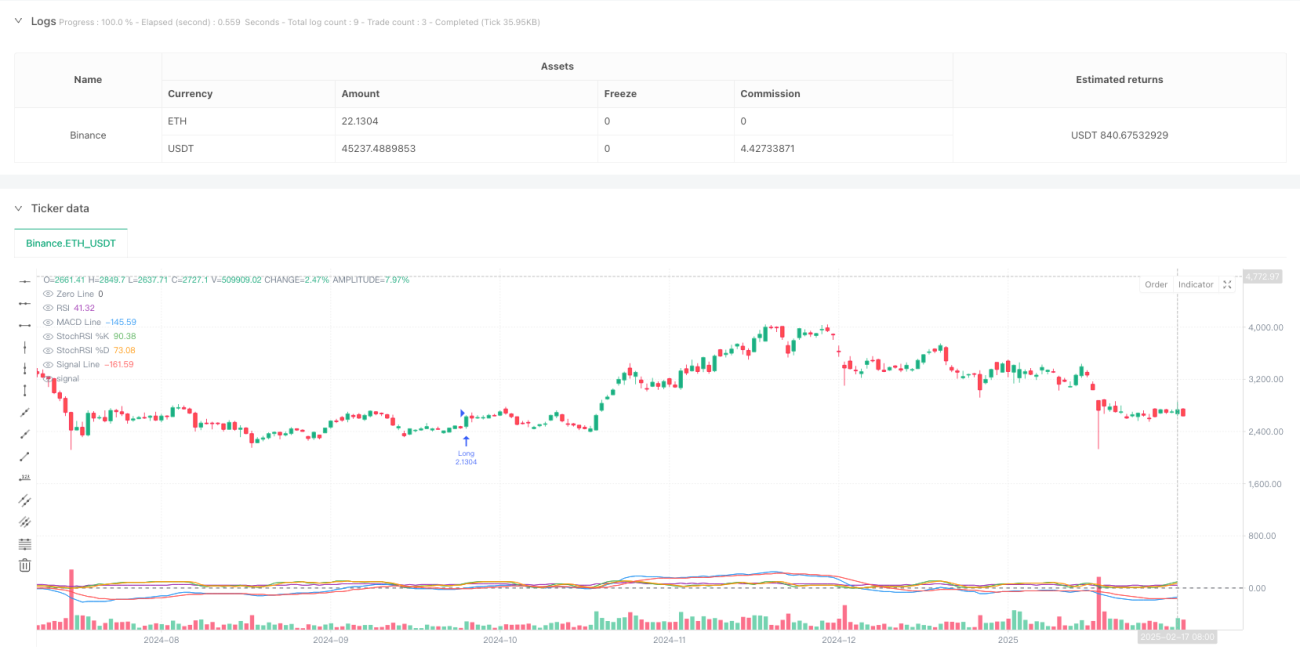
この戦略は,複数の技術指標を組み合わせたトレンド追跡取引システムである. MACDによってトレンドの動力を捉え,RSIとStochRSIを使用して,オーバーバイとオーバーセルの状態を確認し,取引シグナルの有効性を検証するために取引量指標を使用する. 戦略は,ダイナミックな取引量減価メカニズムを採用し,市場が充実しているときにのみ取引を実行することを保証する.
戦略原則
戦略の中核となるロジックは、次の主要な要素に基づいています。
- MACD指標は,価格の動向と動力の変化を識別するために使用され,ファーストラインとスローラインの交差によって初期取引信号を生成します.
- RSI指標は,市場が強さ ((>50) または弱さ ((<50) の状態にあるかどうかを判断するのに役立つトレンド確認ツールです.
- StochRSIは,RSIをランダムな指標で計算することで,より敏感な市場動向情報を提供します.
- 取引量検証メカニズムは,取引が発生した時の取引量は14サイクル平均の取引量の1.5倍以上でなければならないことを要求する.
このシステムでは,以下の条件を満たす場合に多額のポジションを開きます.
- MACDは速線を横切る
- RSIは50以上です
- ストックRSIのK線はD線を横切る
- 現在,取引量は<unk>値を超えています.
システムでは,以下の条件を満たす場合の空白を設定します.
- MACDは速線を下に 遅線を下に
- RSIは50以下です.
- ストックRSIのK線はD線を通過する
- 現在,取引量は<unk>値を超えています.
戦略的優位性
- 複数の技術指標の組み合わせにより,より信頼性の高い取引シグナルを提供し,偽のシグナルのリスクが軽減されます.
- 取引量確認メカニズムは,市場流動性が不足している取引機会を効果的にフィルターします.
- 戦略のパラメータは,異なる市場状況に応じて最適化するために,調整可能である
- トレンドトラッキングとダイナミクス戦略の組み合わせは,大きなトレンドを捉え,短期的な機会を逃さない
- 入力論理の明晰さ,実行と反テストの検証
戦略リスク
- 複数の指標をフィルタリングすると,潜在的な取引機会のいくつかを逃す可能性があります.
- 不安定な市場では、誤ったブレイクアウトシグナルが頻繁に発生する可能性がある
- 資金管理のリスクを高めるため,停止・停止メカニズムを設定していない
- 過去の取引量に依拠し,異常な状況では失効する
- 複数の技術指標の遅れの重なりにより,入場時間が遅れる可能性があります.
リスク管理の提案:
- ストップロスとテイクプロフィットのメカニズムを追加する
- トレンドフィルターを導入します.
- 値のパラメータの組み合わせを最適化
- ポジションの最大時間制限を設定します.
- 貯蔵庫の建設戦略の実施
戦略最適化の方向性
- 適応性のあるパラメータ最適化メカニズムを導入し,市場状況に応じて戦略が指標パラメータを自動的に調整できるようにする
- 市場波動率のフィルターを追加し,異なる波動環境で異なる取引ルールを適用する
- 資金管理システムを完善し,ダイナミックポジション管理とリスク管理のメカニズムを導入
- スマートフィルタリングアルゴリズムを開発し,波動市場における偽信号を減らす
- 市場情緒指標を統合し,取引信号の正確性を向上させる
要約する
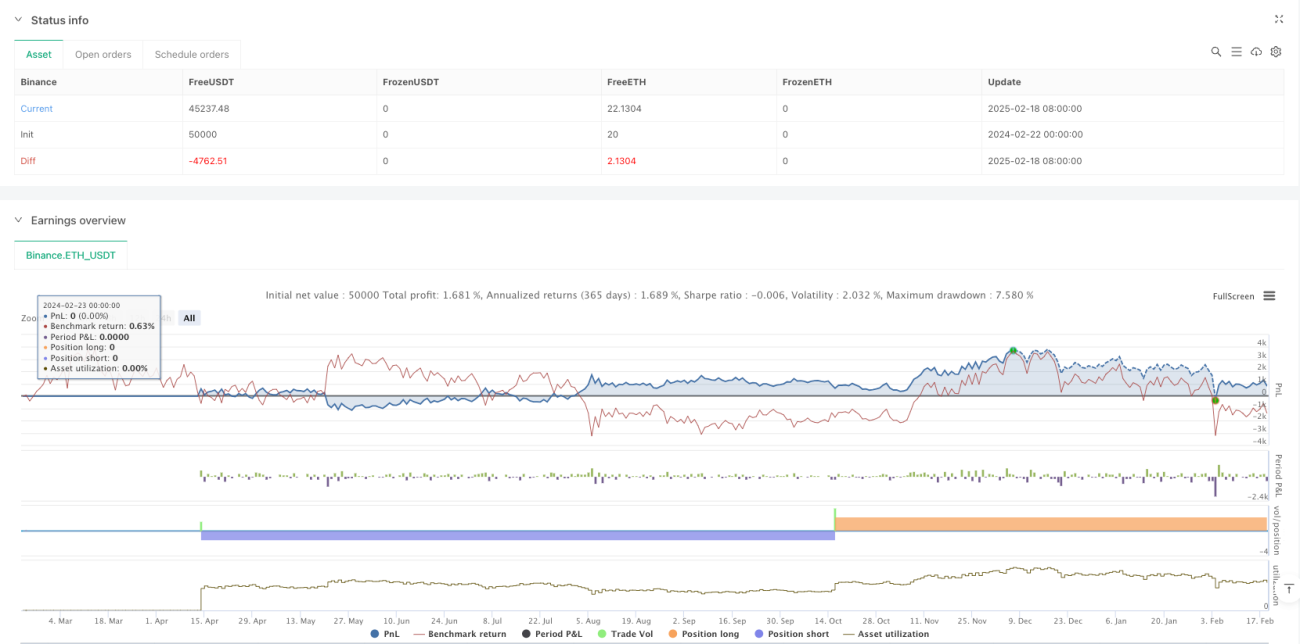
この戦略は,複数の技術指標の協調的な配合によって,比較的完全な取引システムを構築している.取引量確認メカニズムの追加は,取引信号の信頼性を高めていますが,システムは,リスク管理とパラメータの最適化に関して,まだ完善する必要があります.戦略の核心的な優位性は,その論理の明確性,調整の強さ,基礎フレームワークとしてさらなる最適化と拡張に適合することです.
Source
Pine
/*backtest
start: 2024-02-22 00:00:00
end: 2025-02-19 08:00:00
period: 1d
basePeriod: 1d
exchanges: [{"eid":"Binance","currency":"ETH_USDT"}]
*/

//@version=5
strategy("BTCUSDT Strategy with Volume, MACD, RSI, StochRSI", overlay=true, default_qty_type=strategy.percent_of_equity, default_qty_value=10)

// Input parametersStrategy parameters
Related strategies
Comment
All comments (0)
No data
- 1