
2
Follow
478
Followers
概要
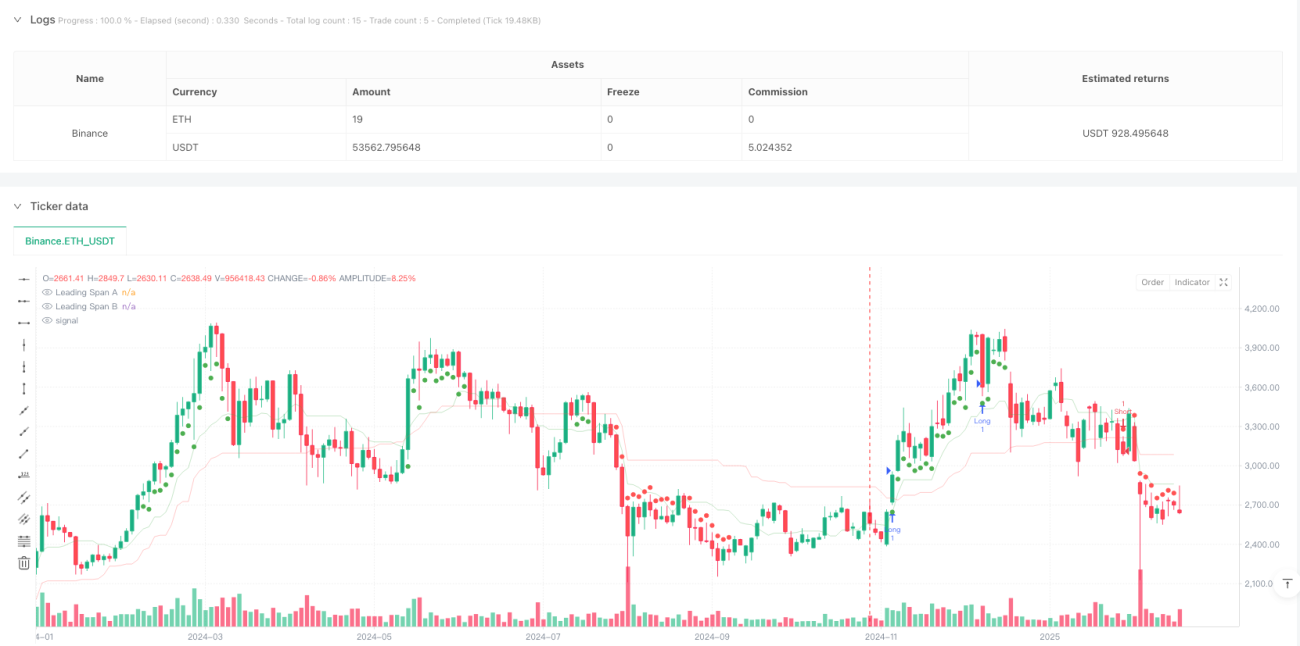
この戦略は,市場動向,動力,波動率の3次元分析を組み合わせた多指標融合のトレンド追跡取引システムである. 核心ロジックは,市場動向を判断するインジケーターの雲 (イチモクククラウド),MACD直線図の動態を確認する,ブルリン帯域幅 (ボリンジャー帯域幅) フィルター市場の波動状態を判断し,周線レベルのトレンド確認メカニズムを導入し,最終的にATRベースのダイナミックストップでリスクを管理する.
戦略原則
策略は,複数の層の信号フィルタリング機構を採用する.まずは,一雲指標の先導跨度AとBによって,価格が雲層の上下にあるかどうかを判断し,市場の大きな傾向を決定する.次は,MACD直線図を使用して,動量の強さを判断し,多頭時直線図を0.05より大きい,空頭時0より小さいとする.第三は,周線時間周期の50周期平均線を導入し,より大きなレベルの傾向方向を確認する.第四は,ブリン帯域幅度指標をフィルタリングして,幅が0.02より大きい場合にのみ,低波動率の動きをフィルターする.
戦略的優位性
- 多次元信号フィルタリング:傾向,動量,波動率の3次元指標の組み合わせによって,偽信号を効果的に減少させる.
- 多時間周期分析:周回線トレンド確認を導入し,取引方向の正確性を向上させる.
- ダイナミックなリスク管理:ATRとブリン・バンド幅に基づく自律的な止損機構,利益を保護しながらトレンドの発展の余地を与える.
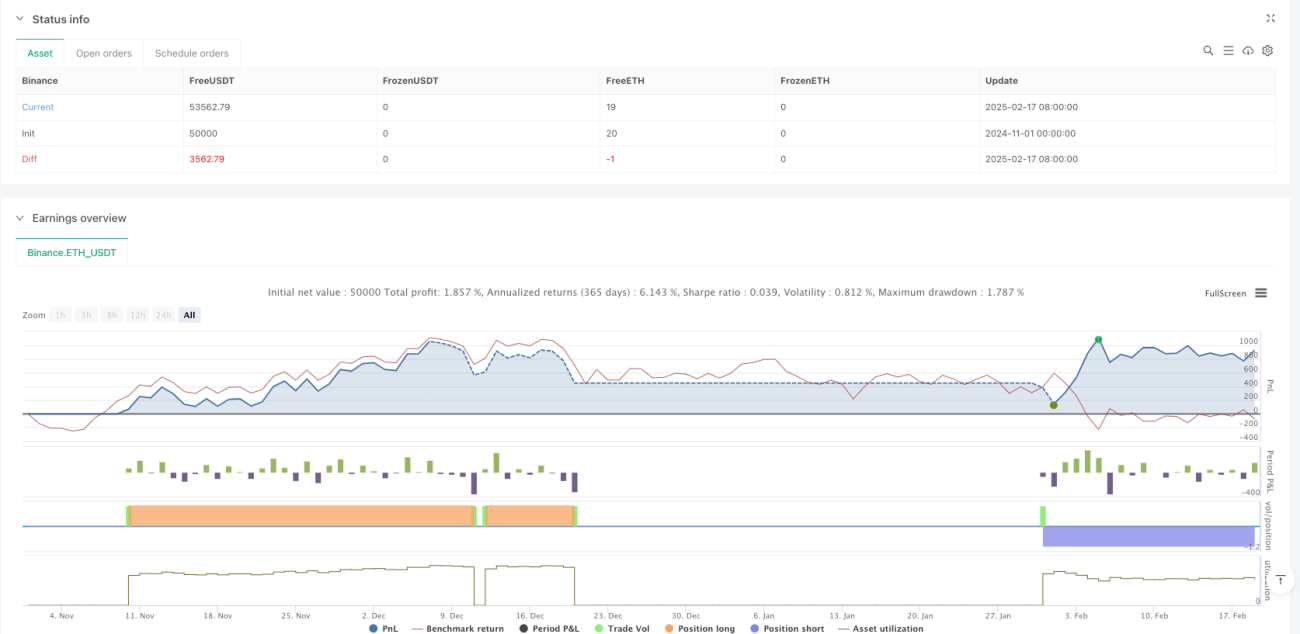
- 返済効果は優れている:純利益10.80%,損益比2.593,勝率50.70%,最大回収率は1.47%しかなかった。
戦略リスク
- トレンド依存性: 波動的な市場では,策略が頻繁に偽信号を生成する可能性があります.
- パラメータの感受性:複数の指標のパラメータは,異なる市場条件に最適化する必要があります.
- 遅延リスク:複数の信号のフィルタリングにより,入場時刻が遅れて行方不明になる可能性があります.
- 追溯の限界:過去の業績は将来の業績を意味しない. スライドポイントと手数料も考慮する必要がある.
戦略最適化の方向性
- 信号システムの最適化:RSIなどの他の動力指標を導入して,信号の信頼性を強化する.
- ポジション管理の最適化:変動率に基づいてポジションのサイズを動的に調整できます.
- 停止機構の最適化:移動停止または技術指標に基づく停止条件を追加することができる.
- 市場適応性最適化:異なる市場状況に合わせて動的調整パラメータ.
要約する
この戦略は,多次元指標融合と多時間周期分析により,完全なトレンド追跡システムを構築し,ダイナミックなリスク管理機構を備えています.反測のパフォーマンスは優れていますが,市場環境の変化に伴うリスクには注意を払い,実体で慎重に検証し,継続的に最適化することをお勧めします.
Source
Pine
/*backtest
start: 2024-11-01 00:00:00
end: 2025-02-19 08:00:00
period: 2d
basePeriod: 2d
exchanges: [{"eid":"Binance","currency":"ETH_USDT"}]
*/

// This Pine Script™ code is subject to the terms of the Mozilla Public License 2.0 at https://mozilla.org/MPL/2.0/
// © FIWB
//@version=6
strategy("Momentum Edge Strategy - 1D BTC Optimized", overlay=true)Strategy parameters
Related strategies
Comment
All comments (0)
No data
- 1