
2
Follow
478
Followers
概要
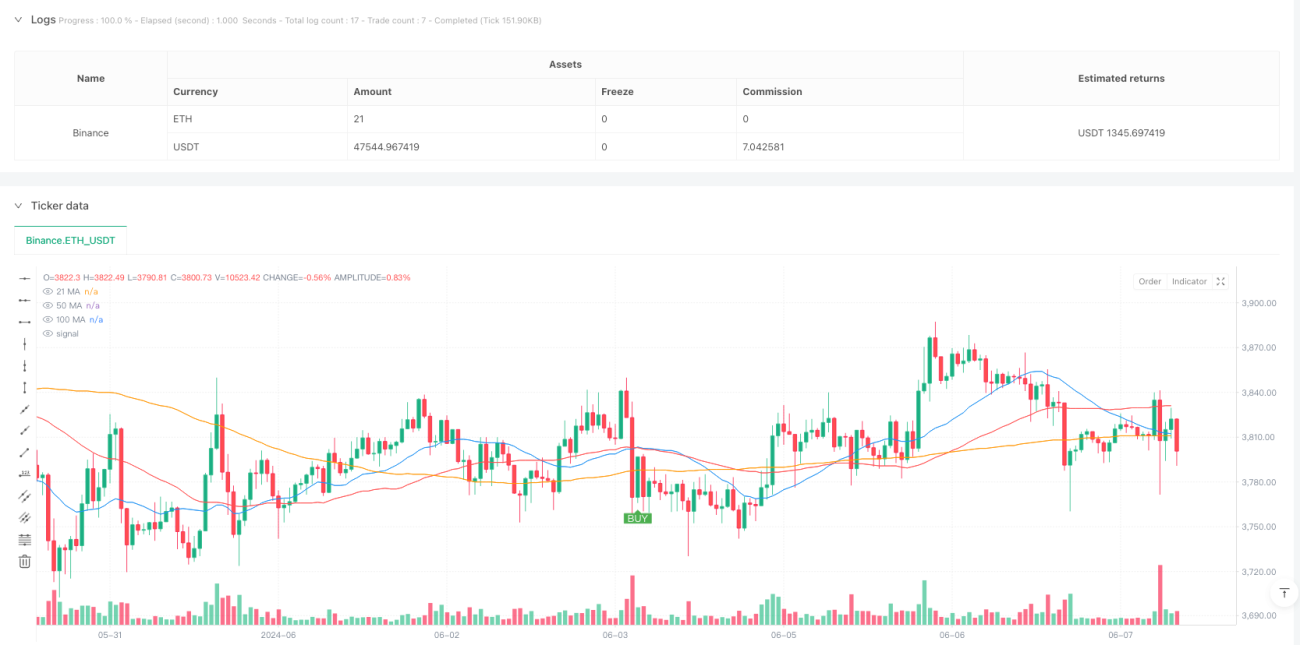
これは,3つのシンプル移動平均 (SMA) に基づくトレンド追跡戦略である. この戦略は,21,50,100周期移動平均の交差と位置関係を利用して,市場トレンドを認識し,適切なタイミングで取引を行う. この戦略は主に5分間の時間枠で動作し,30分間のグラフを参照してトレンドを確認することを推奨する.
戦略原則
戦略は3つのフィルタリングメカニズムを使用して取引信号を決定します.
- 21周期平均線を高速平均線として使用し,短期的な価格変動を捉える
- 50周期平均線を中間平均線として用いて,急速平均線と交差信号を形成
- 100周期平均線をトレンドフィルターとして使用し,取引の方向が主トレンドと一致することを確認する.
購入条件は同時に満たされている必要があります:
- 平均線21は,平均線50を通って上へ
- 平均線21と平均線50は,平均線100の上にあります.
販売条件は以下の通りです.
- 平均線21は,平均線50を通って,下を向いています.
- 平均線21と平均線50は,平均線100の下にある.
戦略的優位性
- 多重確認メカニズムにより 偽信号の減少
- トレンドフィルターにより取引成功率が向上
- 明確な入場・出場ルール
- 複数のタイムフレームで使用できます.
- リスク・リターン・レシオンは1:2に設定され,長期的な利益に有利です.
- 戦略の論理はシンプルで,理解し,実行しやすい.
戦略リスク
- 市場が揺れ動くと取引が頻発する可能性がある
- 平均線遅れにより,出場と入場が遅れる可能性がある.
- 急速な逆転が大きな損失をもたらす可能性がある.
- パラメータの調整は市場環境によって異なります.
リスク管理の提案:
- ストップ・ローは,近年の重要低点より下にある.
- より長い時間帯の確認傾向と組み合わせた
- 横軸の変動市場での取引を避ける
- 定期的な評価と最適化戦略のパラメータ
戦略最適化の方向性
- トレンドの強さを確認する取引量指標の導入
- ダイナミック・ストップ・メカニズムの追加
- トレンド強度フィルターを追加
- 最適化パラメータの自己適応機構
- 他の技術指標と組み合わせた信号確認
- 市場の変動率のフィルターを増やす
要約する
これは,構造が整った,論理が明確なトレンド追跡戦略である. 三重均線フィルタリングとトレンド確認機構により,偽信号を効果的に軽減し,取引成功率を向上させることができる. この戦略は,優れた拡張性を持ち,異なる市場環境に応じて最適化調整を行うことができる.
Source
Pine
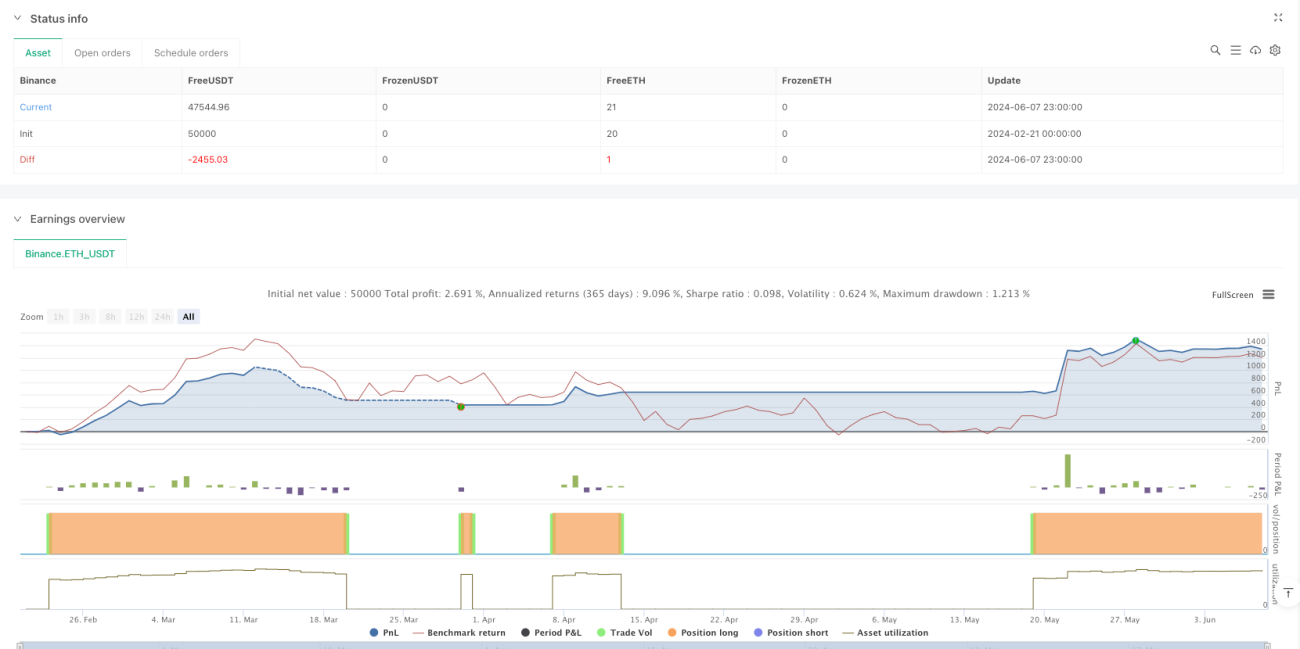
/*backtest
start: 2024-02-21 00:00:00
end: 2024-06-08 00:00:00
period: 1h
basePeriod: 1h
exchanges: [{"eid":"Binance","currency":"ETH_USDT"}]
*/

// This Pine Script™ code is subject to the terms of the Mozilla Public License 2.0 at https://mozilla.org/MPL/2.0/
// © Vezpa
//@version=5
strategy("Vezpa's Gold Strategy", overlay=true)Strategy parameters
Related strategies
Comment
All comments (0)
No data
- 1