
2
Follow
502
Followers
概要
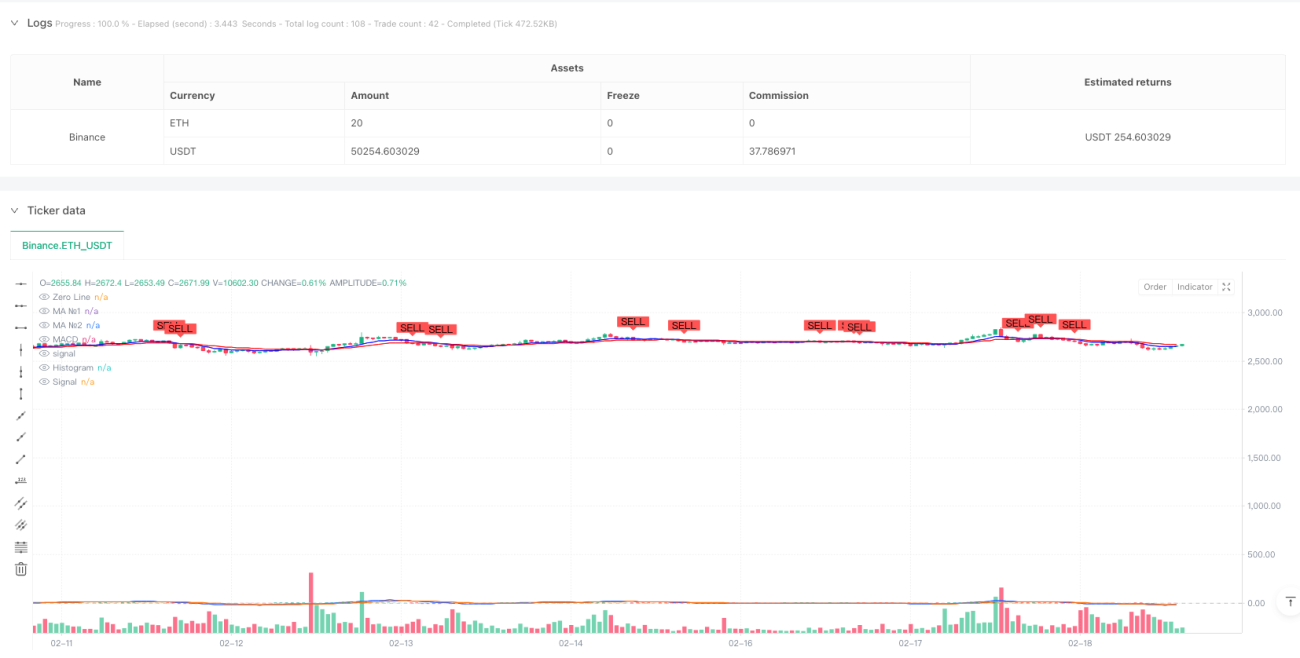
本戦略は、マルチ期間移動平均線バンドとMACDインジケーターを組み合わせた取引システムです。主に短期・長期移動平均線のクロスとMACDのシグナルを用いて市場のトレンドと取引タイミングを判断します。また、当日取引リセットロジックを組み込んでおり、オーバーナイトリスクを効果的に回避します。
戦略の原理
戦略の核心ロジックは3つの主要部分から構成されます。移動平均線バンドシステム、MACDインジケーターシステム、および当日取引リセットメカニズムです。移動平均線バンドは2つの異なる期間(9と21)の移動平均線で構成され、SMA、EMA、SMMA、WMA、VWMAなど複数のタイプから選択可能です。MACDシステムは標準の12/26/9パラメータ設定を採用し、速い線と遅い線の差およびシグナル線を用いてトレンドのモメンタムを判断します。買いシグナルは、短期移動平均線が長期移動平均線を上抜け、かつMACD線がシグナル線を上抜けるという2つの条件が同時に成立した場合に発生します。売りシグナルは、いずれかの逆クロスが発生した時点でトリガーされます。各取引日の開始時にシグナル状態がリセットされ、取引の連続性と安全性が確保されます。
戦略の利点
- ダブル確認による信頼性:トレンド追跡とモメンタム指標を組み合わせることで、偽シグナルのリスクを大幅に低減
- 柔軟なパラメータ設定:複数種類の移動平均線に対応し、市場の特性に応じて最適化が可能
- リスク管理の充実:当日取引リセットメカニズムにより、オーバーナイトリスクを効果的に回避
- 視覚効果が優れている:明確な売買シグナルマークと移動平均線バンド表示を統合し、取引判断を支援
戦略のリスク
- トレンド転換の遅れ:移動平均線システムを使用するため、市場が急反転した場合に反応が遅れる可能性がある
- レンジ相場には不向き:横ばいのレンジ相場では頻繁に偽シグナルが発生する可能性がある
- パラメータ最適化の難しさ:市場環境によって最適なパラメータが大きく異なる可能性がある
- 執行遅延の影響:ボラティリティの高い市場では、シグナル確認から実際の執行までの間に大きな価格差が生じる可能性がある
戦略の最適化方向
- ボラティリティフィルターの導入:ATRやボラティリティ指標を追加し、高ボラティリティ環境ではシグナル発動の閾値を調整する
- シグナル確認メカニズムの最適化:出来高確認や価格パターン確認を追加し、シグナルの信頼性を向上させる
- リスク管理の強化:動的ストップロスと利益確定目標を追加し、戦略のリスクリワード比を改善する
- 市場環境への適応:市場の状態に応じてパラメータを動的に調整し、戦略の適応性を高める
まとめ
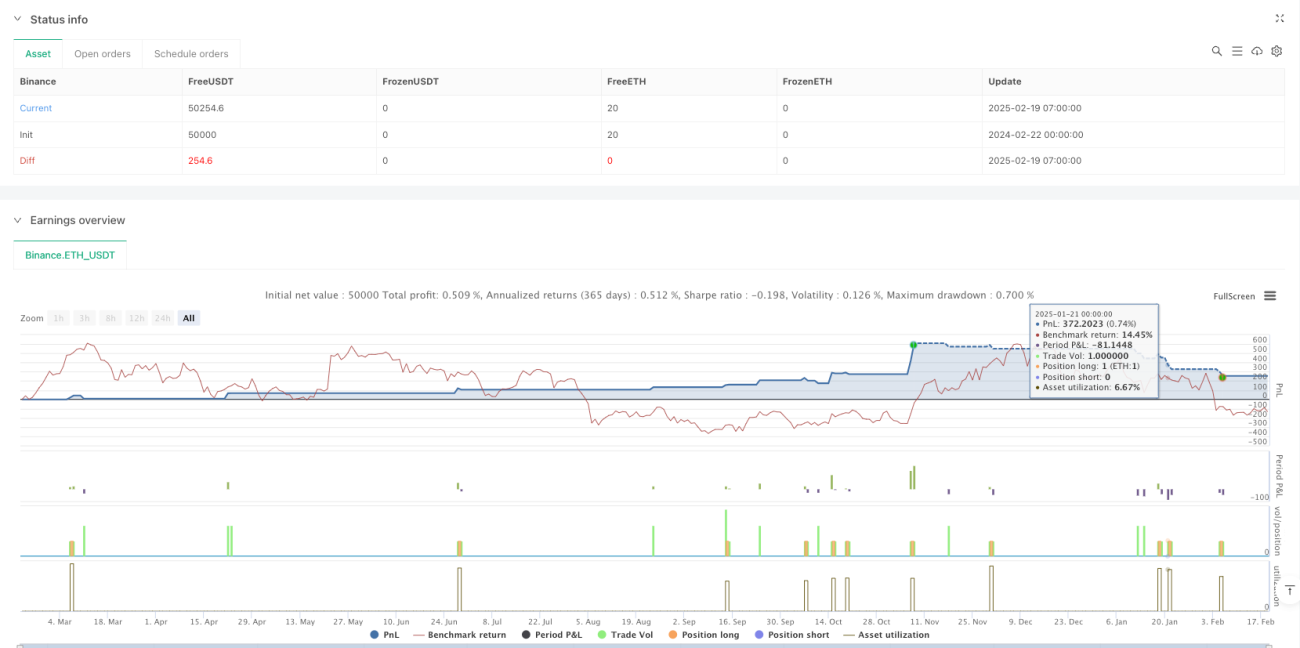
本戦略は、移動平均線バンドとMACDインジケーターを組み合わせることで、比較的完成度の高い取引システムを構築しています。一定の遅れリスクはありますが、適切なパラメータ最適化とリスク管理により、トレンド相場で良好な結果を得ることが可能です。トレーダーは実際の取引に使用する前に十分なバックテストを行い、市場の特性に応じてパラメータを調整することを推奨します。
Source
Pine
Strategy parameters
Related strategies
Comment
All comments (0)
No data
- 1