複数のKラインパターンに基づくトリプルストライク定量取引戦略

TLS ECS K-LINE MA PATTERN Trend momentum
作成日: 2025-02-21 11:00:33 最終変更日: 2025-02-27 17:12:20
コピー: 1 クリック数: 382
2
フォロー
319
フォロワー

複数のKラインパターンに基づくトリプルストライク定量取引戦略 複数のKラインパターンに基づくトリプルストライク定量取引戦略

概要

これは,Three Line StrikeとEngulfing Patternに基づいた量化取引戦略である.この戦略は,連続した3つのK線形状の後に突破的な反転K線を識別することで,市場トレンドの転換点を捉え,複数の技術指標を組み合わせて取引決定を行う.この戦略は,完全な信号認識システムとリスク制御機構を設計し,高度にカスタマイズ可能なパラメータ設定を提供します.

戦略原則

戦略の核心的な論理は,2つの主要なK線形状に基づいています.

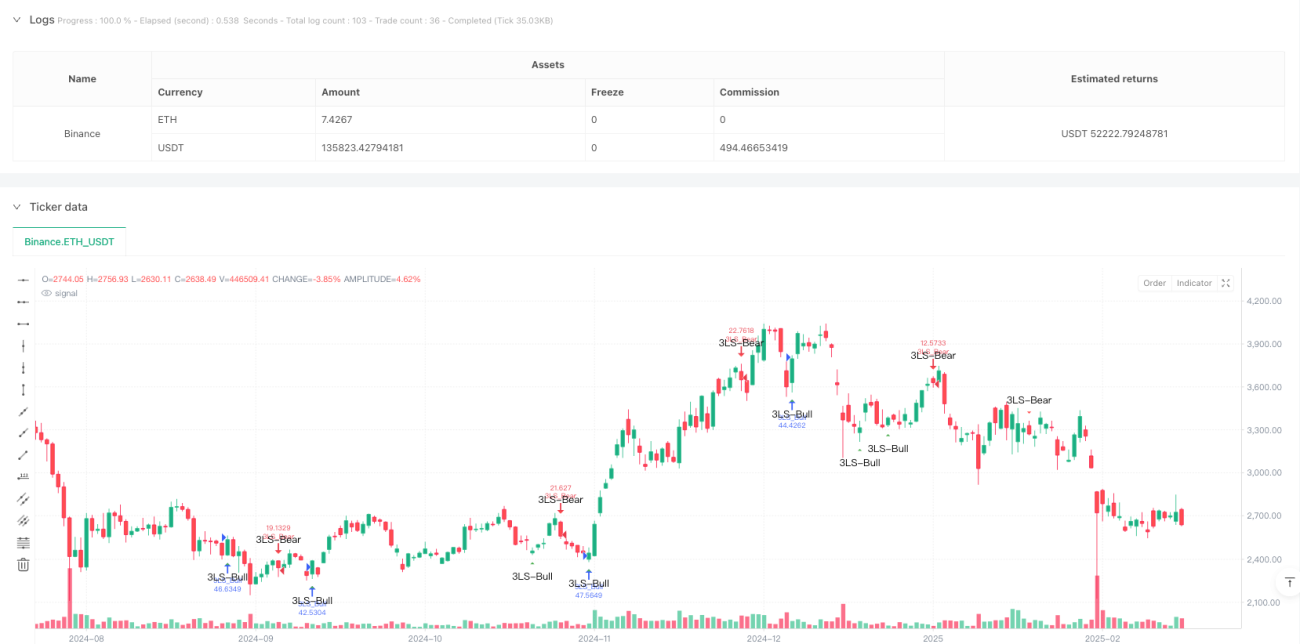
  1. 三重打撃形:連続した3つの同方向K線に続く反転K線を識別してトレンドの逆転を判断する.看板形は,連続した3つの下落した赤K線に続く1つの大きな緑のK線を吸収した形;看板形は,連続した3つの上昇した緑K線に続く1つの大きな赤のK線を吸収した形である.
  2. 吸収形態:個別の大きな吸収K線も補助信号として用いられる. 戦略は,現在のK線と前回のK線の実体サイズを比較することによって吸収形態を識別する.

戦略的優位性

  1. 信号識別精度:策略は,厳格な数学計算方法を使用してK線形状を判断し,複数の条件のフィルタリングによって信号品質を保証する.
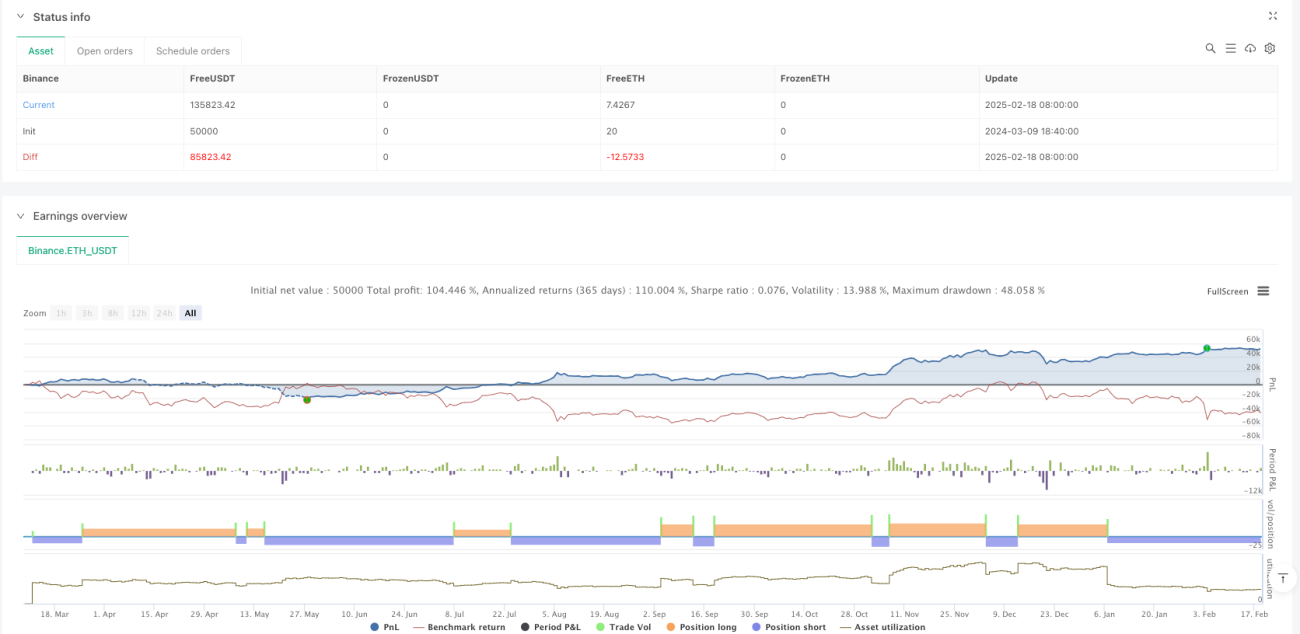
  2. リスク管理は完善です.初期資金,保有比率などのリスクパラメータが設定され,再入場は禁止されています.
  3. 高度カスタマイズ:様々な市場特性と取引需要に応じて最適化できる豊富なパラメータ設定を提供します.
  4. ビジュアルサポート:分析とモニタリングを容易にするために,明確なグラフィックマークと提示情報を提供します.

戦略リスク

  1. 市場環境依存: 波動的な市場では,偽信号が過剰に発生する可能性があります.
  2. スライドポイントの影響:大規模なK線を吸収する入口点は,より大きなスライドポイントの影響を受ける可能性があります.
  3. 遅延リスク:形状認識はK線を多く必要とし,最適な入場時間を逃す可能性があります.

戦略最適化の方向性

  1. 交差量指標の導入:交差量の変化を組み合わせて信号の質をフィルターする.
  2. オプティマイズストップ設定:ATRまたは波動率に基づいてストップポジションを動的に調整する.
  3. トレンドフィルターを追加: 平均線システムで全体的なトレンドを判断する.
  4. 退出の仕組みを改良し,より柔軟に収益を上げることを設計する.

要約する

この戦略は,体系化された技術分析方法によって市場の重要な転換点を捉え,強力な理論的基礎と実戦的な価値を持っています.パラメータの最適化とリスク制御の完善によって,健全な取引システムの重要な構成要素として使用できます.戦略のモジュール化設計はまた,さらなる最適化のための良い基盤を提供します.

Overview

This is a quantitative trading strategy based on Three Line Strike and Engulfing patterns. The strategy captures market turning points by identifying breakthrough reversal candlesticks following three consecutive candles, combining multiple technical indicators for trading decisions. It features a complete signal detection system and risk control mechanism, with highly customizable parameter settings.

Strategy Principle

The core logic is based on two main candlestick patterns:

  1. Three Line Strike Pattern: Identifies trend reversals through three consecutive same-direction candles followed by a reversal candle. Bullish pattern consists of three consecutive red candles followed by a large green engulfing candle; bearish pattern consists of three consecutive green candles followed by a large red engulfing candle.
  2. Engulfing Pattern: Large single engulfing candles serve as auxiliary signals. The strategy identifies engulfing patterns by comparing the body size of current and previous candles.

Strategy Advantages

  1. Precise Signal Identification: Uses strict mathematical calculations to judge candlestick patterns, ensuring signal quality through multiple condition filtering.
  2. Comprehensive Risk Control: Includes risk parameters like initial capital and position sizing, with pyramiding prevention.
  3. Highly Customizable: Offers rich parameter settings for optimization according to different market characteristics and trading needs.
  4. Visual Support: Provides clear graphical markers and alert messages for analysis and monitoring.

Strategy Risks

  1. Market Environment Dependency: May generate excessive false signals in ranging markets.
  2. Slippage Impact: Entry points for large engulfing candles may be subject to significant slippage.
  3. Delay Risk: Pattern recognition requires multiple candles, potentially missing optimal entry points.

Optimization Directions

  1. Incorporate Volume Indicators: Filter signal quality by combining volume changes.
  2. Optimize Stop Loss Settings: Dynamically adjust stop loss positions based on ATR or volatility.
  3. Add Trend Filtering: Implement moving average systems to judge overall trend.
  4. Improve Exit Mechanism: Design more flexible profit-taking conditions.

Summary

The strategy captures important market turning points through systematic technical analysis, with strong theoretical foundation and practical value. Through parameter optimization and risk control refinement, it can serve as an important component of a robust trading system. The modular design also provides a good foundation for further optimization.

ストラテジーソースコード
/*backtest
start: 2024-03-09 18:40:00
end: 2025-02-19 08:00:00
period: 1d
basePeriod: 1d
exchanges: [{"eid":"Binance","currency":"ETH_USDT"}]
*/

// Copyright ...
// Based on the TMA Overlay by Arty, converted to a simple strategy example.
// Pine Script v5

//@version=5
strategy(title='3 Line Strike [TTF] - Strategy',
     shorttitle='3LS Strategy [TTF]',
     overlay=true,
     initial_capital=100000,
     default_qty_type=strategy.percent_of_equity,
     default_qty_value=100,
     pyramiding=0)

// -----------------------------------------------------------------------------
//                               INPUTS
// -----------------------------------------------------------------------------

//
// ### 3 Line Strike
//
showBear3LS = input.bool(title='Show Bearish 3 Line Strike', defval=true, group='3 Line Strike',
     tooltip="Bearish 3 Line Strike (3LS-Bear) = 3 green candles followed by a large red candle (engulfing).")
showBull3LS = input.bool(title='Show Bullish 3 Line Strike', defval=true, group='3 Line Strike',
     tooltip="Bullish 3 Line Strike (3LS-Bull) = 3 red candles followed by a large green candle (engulfing).")
showMemeChars = input.bool(title="Plot 3 Line Strike meme symbols", defval=false, group="3 Line Strike")

//
//### Engulfing Candles
//
showBearEngulfing= input.bool(title='Show Bearish Big Candles', defval=false, group='Big Candles')
showBullEngulfing= input.bool(title='Show Bullish Big Candles', defval=false, group='Big Candles')

//
//### Alerts
//
void = input.bool(title="(Info) Alerts are based on detected signals.", defval=true)

// -----------------------------------------------------------------------------
//                          HELPER FUNCTIONS
// -----------------------------------------------------------------------------

// Function: Get the 'color' of the candle: -1 = red, 0 = doji, +1 = green
getCandleColorIndex(barIndex) =>
    int ret = na
    if (close[barIndex] > open[barIndex])
        ret := 1
    else if (close[barIndex] < open[barIndex])
        ret := -1
    else
        ret := 0
    ret

// Function: Check if the candle is engulfing (based on the body size of the candles)
isEngulfing(checkBearish) =>
    // Size of the previous candle
    sizePrevCandle = close[1] - open[1]
    // Size of the current candle
    sizeCurrentCandle = close - open
    isCurrentLargerThanPrevious = math.abs(sizeCurrentCandle) > math.abs(sizePrevCandle)
    
    // Bearish / Bullish division
    if checkBearish
        // Bearish engulfing: previous green, current larger red
        isGreenToRed = (getCandleColorIndex(0) < 0) and (getCandleColorIndex(1) > 0)
        isCurrentLargerThanPrevious and isGreenToRed
    else
        // Bullish engulfing: previous red, current larger green
        isRedToGreen = (getCandleColorIndex(0) > 0) and (getCandleColorIndex(1) < 0)
        isCurrentLargerThanPrevious and isRedToGreen

// Simplified calls for bullish/bearish engulfing
isBearishEngulfing() => isEngulfing(true)
isBullishEngulfing() => isEngulfing(false)

// Function: 3 consecutive candles of one color followed by the opposite engulfing candle
// 3 Line Strike - Bearish
is3LSBear() =>
    // Three consecutive green candles?
    is3LineSetup = (getCandleColorIndex(1) > 0) and (getCandleColorIndex(2) > 0) and (getCandleColorIndex(3) > 0)
    // Followed by Bearish engulfing
    is3LineSetup and isBearishEngulfing()

// 3 Line Strike - Bullish
is3LSBull() =>
    // Three consecutive red candles?
    is3LineSetup = (getCandleColorIndex(1) < 0) and (getCandleColorIndex(2) < 0) and (getCandleColorIndex(3) < 0)
    // Followed by Bullish engulfing
    is3LineSetup and isBullishEngulfing()

// -----------------------------------------------------------------------------
//                             SIGNALS
// -----------------------------------------------------------------------------

// ### 3 Line Strike
is3LSBearSig = is3LSBear()
is3LSBullSig = is3LSBull()

// Meme icons vs. standard shapes
plotchar(showBull3LS and showMemeChars ? is3LSBullSig : na, char="🍆", color=color.rgb(0, 255, 0, 0),
         location=location.belowbar, size=size.tiny, text='3LS-Bull', title='3 Line Strike Up (Meme Icon)', editable=false)
plotchar(showBear3LS and showMemeChars ? is3LSBearSig : na, char="🍑", color=color.rgb(255, 0, 0, 0),
         location=location.abovebar, size=size.tiny, text='3LS-Bear', title='3 Line Strike Down (Meme Icon)', editable=false)

plotshape(showBull3LS and not showMemeChars ? is3LSBullSig : na, style=shape.triangleup,
         color=color.green, location=location.belowbar, size=size.small, text='3LS-Bull', title='3 Line Strike Up')
plotshape(showBear3LS and not showMemeChars ? is3LSBearSig : na, style=shape.triangledown,
         color=color.red, location=location.abovebar, size=size.small, text='3LS-Bear', title='3 Line Strike Down')

// ### Engulfing Candles
isBullEngulfingSig = isBullishEngulfing()
isBearEngulfingSig = isBearishEngulfing()

plotshape(showBullEngulfing ? isBullEngulfingSig : na, style=shape.triangleup,
         location=location.belowbar, color=color.new(color.green,0), size=size.tiny, title='Big Candle Up')
plotshape(showBearEngulfing ? isBearEngulfingSig : na, style=shape.triangledown,
         location=location.abovebar, color=color.new(color.red,0), size=size.tiny, title='Big Candle Down')

// -----------------------------------------------------------------------------
//                               ALERTS
// -----------------------------------------------------------------------------

// 3LS - "Old" alertcondition + "New" alert() (based on what people use)
alertcondition(showBull3LS and is3LSBullSig, title='Bullish 3 Line Strike',
     message='{{exchange}}:{{ticker}} {{interval}} - Bullish 3 Line Strike')
alertcondition(showBear3LS and is3LSBearSig, title='Bearish 3 Line Strike',
     message='{{exchange}}:{{ticker}} {{interval}} - Bearish 3 Line Strike')

if (showBull3LS and is3LSBullSig)
    m = syminfo.tickerid + ' ' + timeframe.period + ' - Bullish 3 Line Strike'
    alert(message=str.tostring(m), freq=alert.freq_once_per_bar_close)

if (showBear3LS and is3LSBearSig)
    m = syminfo.tickerid + ' ' + timeframe.period + ' - Bearish 3 Line Strike'
    alert(message=str.tostring(m), freq=alert.freq_once_per_bar_close)

// Engulfing - "Old" alertcondition + "New" alert()
alertcondition(showBullEngulfing and isBullEngulfingSig, title='Bullish Engulfing',
     message='{{exchange}}:{{ticker}} {{interval}} - Bullish candle engulfing previous candle')
alertcondition(showBearEngulfing and isBearEngulfingSig, title='Bearish Engulfing',
     message='{{exchange}}:{{ticker}} {{interval}} - Bearish candle engulfing previous candle')

if (showBullEngulfing and isBullEngulfingSig)
    m = syminfo.tickerid + ' ' + timeframe.period + ' - Bullish candle engulfing previous candle'
    alert(message=str.tostring(m), freq=alert.freq_once_per_bar_close)

if (showBearEngulfing and isBearEngulfingSig)
    m = syminfo.tickerid + ' ' + timeframe.period + ' - Bearish candle engulfing previous candle'
    alert(message=str.tostring(m), freq=alert.freq_once_per_bar_close)

// -----------------------------------------------------------------------------
//                          STRATEGY ENTRY ORDERS
// -----------------------------------------------------------------------------
//
// Logic for entering trades. If display is enabled and a signal is detected, a trade will be entered.
//
// 3 Line Strike
if (showBull3LS and is3LSBullSig)
    strategy.entry("3LS_Bull", strategy.long, comment="3LS Bullish")

if (showBear3LS and is3LSBearSig)
    strategy.entry("3LS_Bear", strategy.short, comment="3LS Bearish")

// Engulfing
if (showBullEngulfing and isBullEngulfingSig)
    strategy.entry("BullEngulf", strategy.long, comment="Bullish Engulfing")

if (showBearEngulfing and isBearEngulfingSig)
    strategy.entry("BearEngulf", strategy.short, comment="Bearish Engulfing")

//
// End of script