複数の指標によるトレンド追跡とレンジ取引を組み合わせた適応型戦略

supertrend EMA ADX RSI BB VWAP DMI SMA ATR HLC3
作成日: 2025-02-21 11:08:52 最終変更日: 2025-02-21 11:08:52
コピー: 1 クリック数: 372
2
フォロー
319
フォロワー

複数の指標によるトレンド追跡とレンジ取引を組み合わせた適応型戦略 複数の指標によるトレンド追跡とレンジ取引を組み合わせた適応型戦略

概要

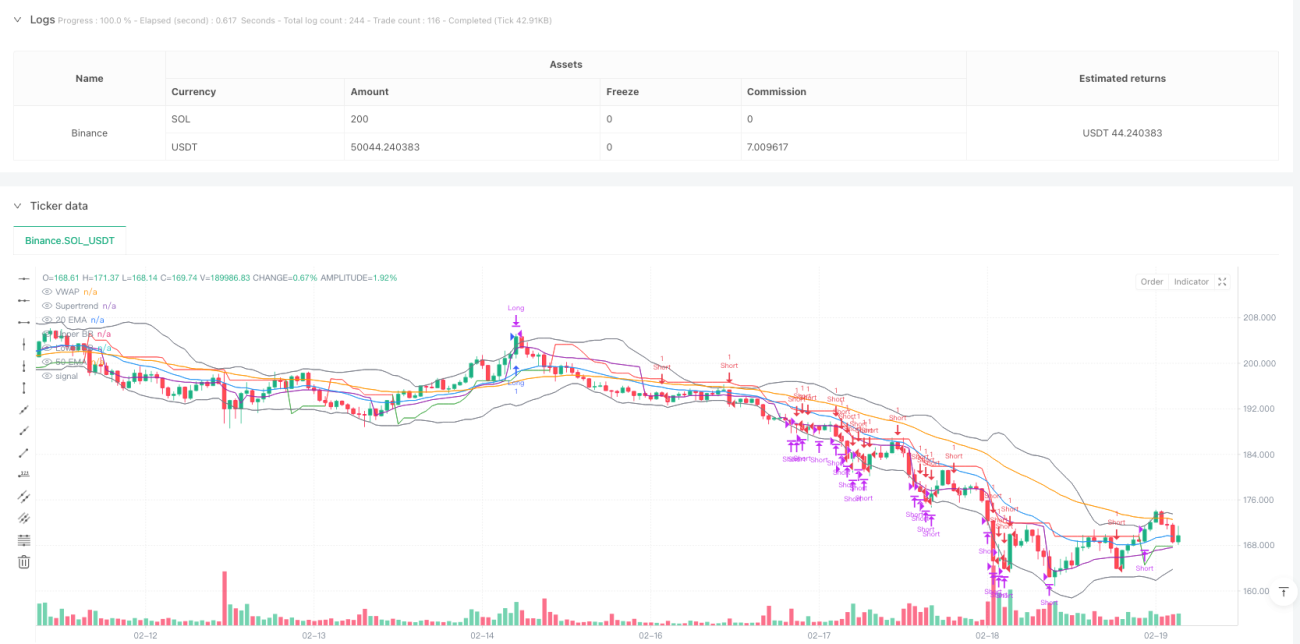
この戦略は,トレンド追跡と区間取引を組み合わせた自己適応的取引システムである.複数の技術指標の協同配合によって,異なる市場環境で柔軟に取引モデルを切り替える.戦略は,スーパートレンド,移動平均線,ADX,RSI,ブリン帯などの指標を使用して,市場状態を認識し,取引シグナルを決定し,VWAPと組み合わせて価格参照を行い,リスクを制御するための止損機構を設定する.

戦略原則

戦略の核心的な論理は,2つの部分に分かれています:トレンド追跡と区間取引.トレンド市場では (ADX>25によって判断される) 戦略は,スーパートレンドの方向,EMAの交差点およびVWAPの位置に基づいてシグナルを生成します. 震動市場では,戦略はブリン帯の境界線とRSIの超買い超売りレベルを利用して取引します.具体的には:

  • トレンド追跡モード:ADX>25時に有効で,20/50周期EMAの位置関係と,スーパートレンドの方向と価格に対するVWAPの位置の総合判断を組み合わせる
  • 区間取引モード:ADX<25で起動し,価格がブリン帯の境界に触れてRSIが極限に達したときに入場
  • 出口条件は,ストップダメージのトリガー,スーパートレンドの反転,またはRSIの極限値に達する.
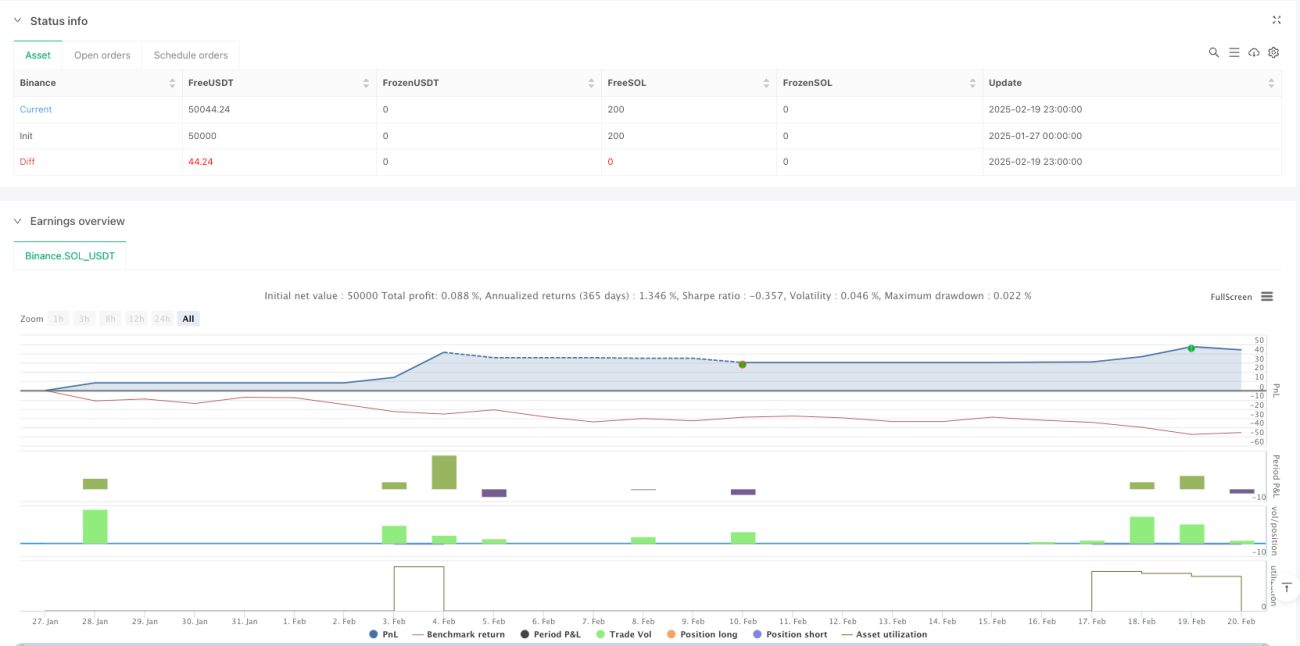
戦略的優位性

  1. 適応性:市場の状況に応じて取引モードを自動的に切り替える
  2. 多重確認:複数の指標のクロス検証により,信号の信頼性が向上する
  3. リスク管理が完ぺき:固定パーセンテージのストップを設定し,RSIの極限値を利用して動的に調整する
  4. 総合性:トレンドを把握し,波動的な市場から利益を得る
  5. ビジュアル支援:重要な指標をグラフィックで示し,意思決定を分析する

戦略リスク

  1. パラメータ感性:複数の指標パラメータの設定は,戦略のパフォーマンスに影響する
  2. 信号遅れ:技術指標自体が遅れている
  3. 偽の突破リスク:横盤市場で偽のシグナルが生じる可能性
  4. 計算の複雑さ:複数の指標のリアルタイム計算は,実行効率に影響を与える
  5. 市場適応性:特定の市場環境では不十分である可能性

戦略最適化の方向性

  1. 動的パラメータ調整:変動率に応じて各指標パラメータを自動的に調整できる
  2. 交差量分析の導入:信号の有効性を検証するための交差量指標の追加
  3. ATR ダイナミック・ストップを考慮する
  4. タイムフィルターを追加: 低効率な時間を避けるために取引時間ウィンドウを追加
  5. 市場情緒指標:予測の正確性を高めるために市場情緒指標を統合する

要約する

これは合理的に設計され,論理的に完結した総合的な戦略である.複数の指標の配合とモデルの切替により,異なる市場環境において一定の適応性を維持することができる.いくつかの潜在的なリスクがあるにもかかわらず,合理的なリスク管理と継続的な最適化によって,この戦略は,実戦での応用価値を有している.実地での使用時に十分なパラメータ最適化と裏付けを推奨している.

ストラテジーソースコード
/*backtest
start: 2025-01-27 00:00:00
end: 2025-02-20 00:00:00
period: 1h
basePeriod: 1h
exchanges: [{"eid":"Binance","currency":"SOL_USDT"}]
*/

//@version=5
strategy("Nifty/BankNifty Multi-Strategy v2", overlay=true, margin_long=100, margin_short=100)

// ———— Inputs ———— //
// Supertrend
atrPeriod = input.int(10, "ATR Period")
supertrendMultiplier = input.float(2.0, "Supertrend Multiplier", step=0.1)

// EMA
ema20Period = input.int(20, "20 EMA Period")
ema50Period = input.int(50, "50 EMA Period")

// ADX/DMI
adxThreshold = input.int(25, "ADX Trend Threshold")
adxLength = input.int(14, "ADX Length")

// RSI
rsiLength = input.int(14, "RSI Length")
rsiOverbought = input.int(70, "RSI Overbought")
rsiOversold = input.int(30, "RSI Oversold")

// Bollinger Bands
bbLength = input.int(20, "BB Length")
bbStdDev = input.float(2.0, "BB Std Dev", step=0.1)

// Stop-Loss
stopLossPerc = input.float(1.0, "Stop-Loss %", step=0.1)

// ———— Calculations ———— //
// Supertrend
[supertrend, direction] = ta.supertrend(supertrendMultiplier, atrPeriod)

// EMAs
ema20 = ta.ema(close, ema20Period)
ema50 = ta.ema(close, ema50Period)

// ADX via DMI (corrected)
[dip, din, adx] = ta.dmi(adxLength, adxLength) // ta.dmi(diLength, adxSmoothing)

// RSI
rsi = ta.rsi(close, rsiLength)

// Bollinger Bands
basis = ta.sma(close, bbLength)
upperBB = basis + ta.stdev(close, bbLength) * bbStdDev
lowerBB = basis - ta.stdev(close, bbLength) * bbStdDev

// VWAP
vwapValue = ta.vwap(hlc3)

// ———— Strategy Logic ———— //
trendingMarket = adx > adxThreshold

// Trend-Following Strategy
emaBullish = ema20 > ema50
priceAboveVWAP = close > vwapValue

longConditionTrend = trendingMarket and direction < 0 and emaBullish and priceAboveVWAP
shortConditionTrend = trendingMarket and direction > 0 and not emaBullish and close < vwapValue

// Range-Bound Strategy
priceNearLowerBB = close <= lowerBB
priceNearUpperBB = close >= upperBB

longConditionRange = not trendingMarket and priceNearLowerBB and rsi < rsiOversold
shortConditionRange = not trendingMarket and priceNearUpperBB and rsi > rsiOverbought

// ———— Entries/Exits ———— //
if (longConditionTrend or longConditionRange)
    strategy.entry("Long", strategy.long)
    stopPriceLong = strategy.position_avg_price * (1 - stopLossPerc / 100)
    strategy.exit("Exit Long", "Long", stop=stopPriceLong)

if (shortConditionTrend or shortConditionRange)
    strategy.entry("Short", strategy.short)
    stopPriceShort = strategy.position_avg_price * (1 + stopLossPerc / 100)
    strategy.exit("Exit Short", "Short", stop=stopPriceShort)

// Exit on Supertrend flip or RSI extremes
if (direction > 0 or rsi >= rsiOverbought)
    strategy.close("Long")

if (direction < 0 or rsi <= rsiOversold)
    strategy.close("Short")

// ———— Visualization ———— //
plot(supertrend, "Supertrend", color = direction < 0 ? color.green : color.red)
plot(ema20, "20 EMA", color.blue)
plot(ema50, "50 EMA", color.orange)
plot(vwapValue, "VWAP", color.purple)
plot(upperBB, "Upper BB", color.gray)
plot(lowerBB, "Lower BB", color.gray)