多指標融合適応型トレンド取引戦略

2
Follow
502
Followers
概要
本戦略は、複数のテクニカル指標を融合した適応型トレンドフォロー・トレーディングシステムです。移動平均線システム(EMA)、モメンタム指標(RSI)、トレンド指標(MACD)、およびSuperTrendを組み合わせてシグナルを確認し、ストップロス、利確、トレーリングストップなどのリスク管理機能を完備しています。市場のボラティリティを考慮し、複数のシグナルフィルターとリスクコントロールを通じて取引の安定性と信頼性を高めています。
戦略の原理
本戦略は多層シグナル確認メカニズムを採用しています:
- 9期間と21期間のEMAのクロスにより初期トレンド方向を判断します。
- RSI(14)を用いて買われ過ぎ・売られ過ぎをフィルタリングし、買いシグナルはRSI>40かつ<70、売りシグナルはRSI<60かつ>30を条件とします。
- MACD指標でトレンドの勢いを検証し、シグナルラインとMACDラインの方向が一致することを要求します。
- SuperTrend指標が追加のトレンド確認を提供します。
- リスク管理は5%のストップロス、10%の利確、2%のトレーリングストップ、1%の損益分岐点を採用します。
すべての条件が同時に満たされた場合のみ取引シグナルが発生し、偽のブレイクアウトによるリスクを効果的に低減します。
戦略の利点
- 多重シグナル確認メカニズムにより、偽シグナルの干渉が大幅に低減されます。
- 固定ストップロス、トレーリングストップ、損益分岐点ストップを含む完全なリスク管理体制を備えています。
- 戦略は適応性に優れ、様々な市場環境に対応できます。
- エントリーとエグジットのロジックが明確で、理解と保守が容易です。
- 取引ロジックは確固たる理論的基盤を持ち、各指標は特定の機能を果たします。
戦略のリスク
- 多重シグナル確認により、重要な取引機会を逃す可能性があります。
- 急激な変動市場では、固定ストップロスが十分に柔軟でない場合があります。
- パラメータ最適化により、過去データに過剰適合する恐れがあります。
- 複数の指標がレンジ相場で混乱したシグナルを生成する可能性があります。
解決策としては、ストップロスパラメータの動的調整、ボラティリティ指標の導入、定期的なパラメータ再最適化などが挙げられます。
戦略の最適化方向
- 適応型パラメータメカニズムを導入し、市場のボラティリティに応じて各パラメータを動的に調整します。
- 出来高指標を補助確認ツールとして追加します。
- ストップロスメカニズムを最適化し、ATRに基づく動的ストップロスを導入します。
- 市場環境認識モジュールを追加し、異なる市場条件下で異なるパラメータ組み合わせを使用します。
- 機械学習ベースのパラメータ最適化システムを開発します。
まとめ
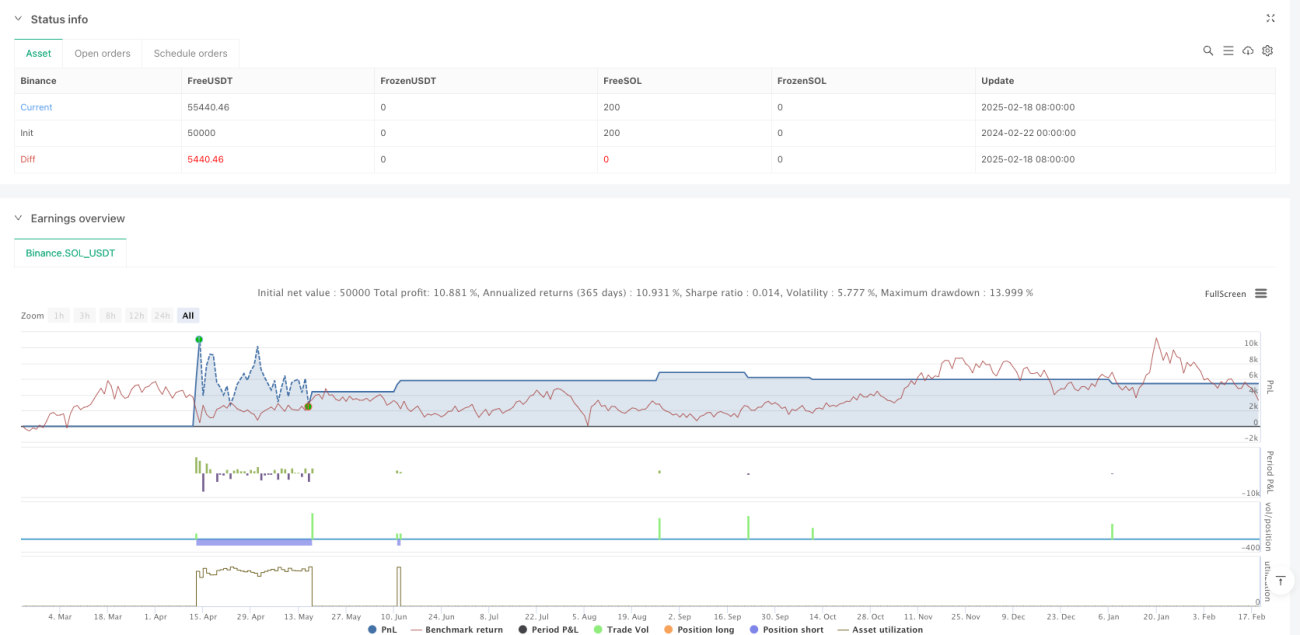
本戦略は、多角的なテクニカル指標の協調により、堅牢なトレーディングシステムを構築しています。完全なリスク管理体制と明確な取引ロジックにより、実用性に優れています。一定の最適化の余地はありますが、戦略の基本フレームワークは確固たる理論的基盤を持ち、継続的な最適化と改善を通じて、さらに取引効果を高めることが期待されます。
Source
Pine
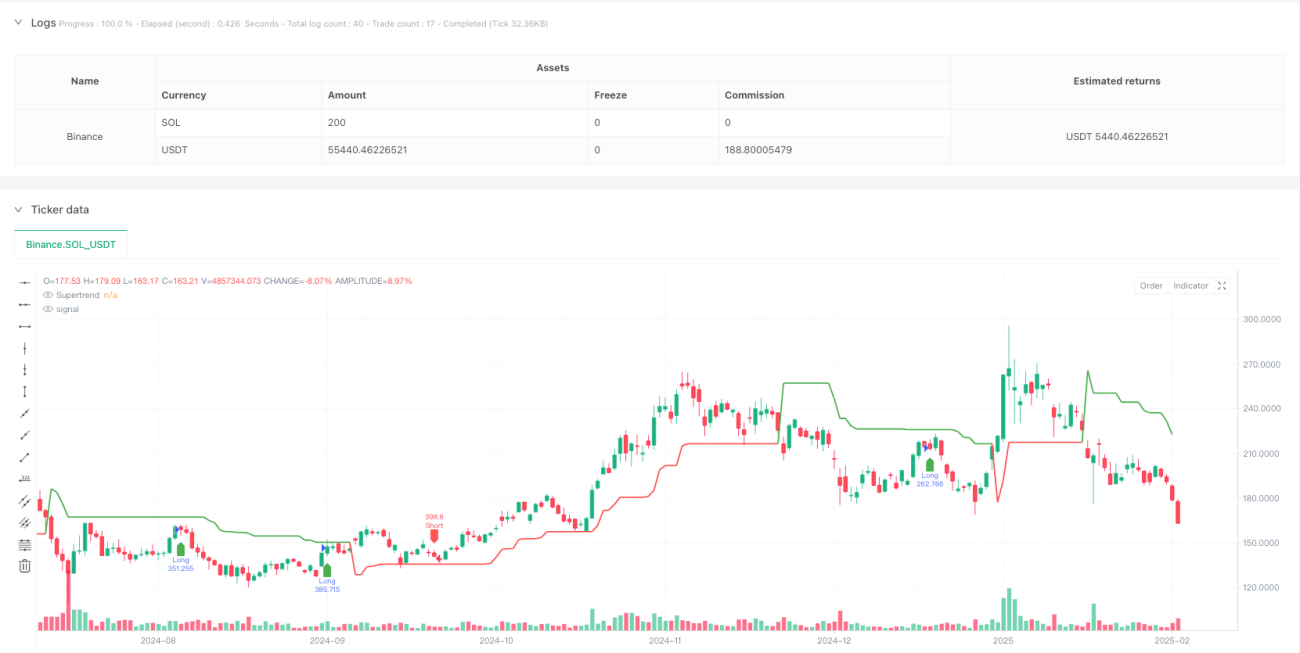
/*backtest
start: 2024-02-22 00:00:00
end: 2025-02-19 08:00:00
period: 1d
basePeriod: 1d
exchanges: [{"eid":"Binance","currency":"SOL_USDT"}]
*/

//@version=5
strategy("Optimized BTC Trading Strategy v2", overlay=true, default_qty_type=strategy.percent_of_equity, default_qty_value=100, commission_type=strategy.commission.percent, commission_value=0.1)

// Input parametersStrategy parameters
Related strategies
Comment
All comments (0)
No data
- 1