ガウスチャネルと確率的相対力指数フィルタリングに基づくトレンド判断戦略

GC RSI SMA K D
作成日: 2025-02-21 11:42:36 最終変更日: 2025-02-21 11:42:36
コピー: 0 クリック数: 425
2
フォロー
319
フォロワー

ガウスチャネルと確率的相対力指数フィルタリングに基づくトレンド判断戦略 ガウスチャネルと確率的相対力指数フィルタリングに基づくトレンド判断戦略

概要

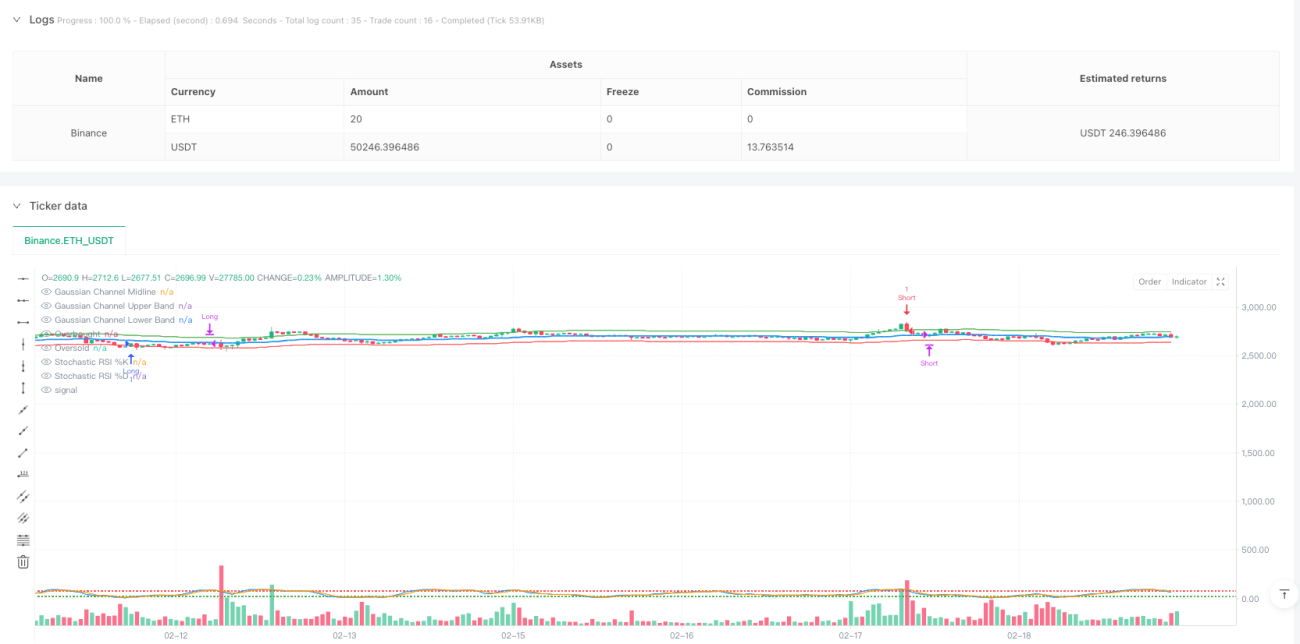
この戦略は,高位チャネルとランダムな比較的強い指数 (Stochastic RSI) を組み合わせたトレンド追跡トレーディングシステムである.高位チャネルは価格の傾向と波動範囲を識別するために使用され,ストキャスティックRSIは,超買い超売り条件を確認するためのフィルターとして使用され,取引シグナルの正確性を向上させます.高位チャネルの境界線とストキャスティックRSIの位置との価格の交差を観察することによって,戦略は取引シグナルを生成します.

戦略原則

戦略の中核となるロジックは、次の主要な要素に基づいています。

  1. 高斯通路計算:高斯フィルターを使用して中線を計算し,倍数設定に基づいて上下通路帯を設定する.高斯フィルターは指数平滑法を採用し,価格騒音を効果的に削減する.
  2. ストキャスティックRSI: ランダムな指標とRSIの優位性を組み合わせて,%Kと%Dの2つの滑り線で超買超売状態を識別する.
  3. 応募条件:
    • 多頭:価格が高斯通路下位を突破し,ストキャスティックRSIは超売り領域にある
    • 空頭:価格が高斯通路の上位軌道から下落し,ストキャスティックRSIは超買い領域にある
  4. 出場条件:
    • 価格がゴス通路の中央線を横切ったとき
    • ストキャスティック・RSIが逆の超買い超売りレベルに達する.

戦略的優位性

  1. 信号の信頼性:トレンドと動力の指標を組み合わせて,偽信号を効率的にフィルターします.
  2. リスク管理の改善:ガース通路を動的支柱のプレッシャーポイントとして使用し,優れたリスク管理の枠組みを提供
  3. パラメータの柔軟性:チャネル幅とRSIのパラメータを異なる市場特性に合わせて調整できます
  4. 計算効率が高い:高斯フィルタは計算量が小さく,リアルタイム取引に適している
  5. 適応性:異なる時間周期と市場環境で使用できる

戦略リスク

  1. 横盤市場では頻繁に偽のブレイクシグナルが生じる可能性がある.
  2. 遅滞のリスク:指標の平滑な処理は,一定の信号遅延を引き起こす
  3. パラメータの感受性: パラメータの異なる組み合わせにより,取引結果が著しく異なる可能性があります.
  4. 市場環境依存: 強いトレンドの市場では優れているが,急速な反転の市場では大きなリターンが生じる可能性がある

戦略最適化の方向性

  1. 動的パラメータ最適化:
    • 市場変動に合わせてチャネル幅を調整する
    • 市場周期特性の動態によるストキャスティックRSIパラメータの調整
  2. シグナル確認のメカニズム
    • 取引量確認の指標を追加
    • トレンド強度フィルターを導入
  3. リスク管理の強化:
    • ダイナミック・ストップ・ダメージ・ストップを実現
    • ポジション管理モジュールへの追加
  4. 市場環境の認識:
    • 市場状態分類器の開発
    • 異なる市場状況に応じて戦略パラメータを調整する
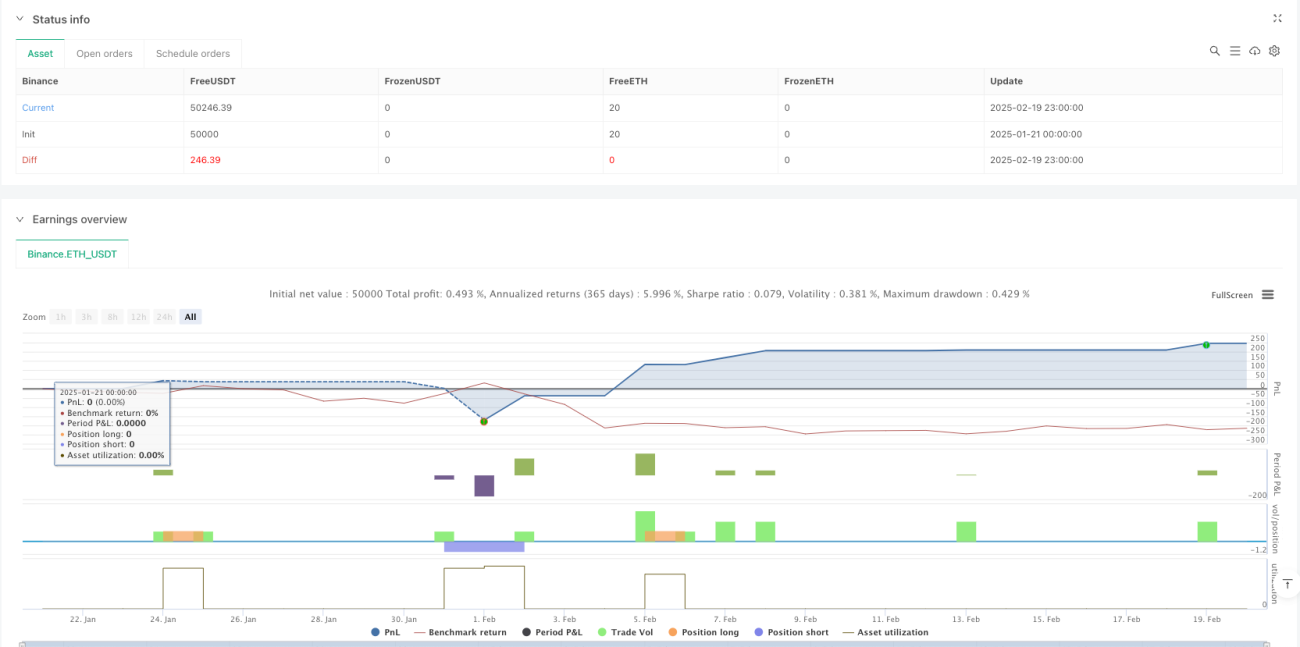
要約する

この戦略は,ガウスチャネルとストキャスティックRSIを組み合わせて,トレンド追跡と動力の特徴を兼ね備えた取引システムを構築する.戦略は合理的に設計され,優れた拡張性と適応性を有する.戦略の安定性と収益性をさらに高めるために,推奨された最適化の方向を介して.実際のアプリケーションでは,異なるパラメータの組み合わせを十分にテストし,特定の市場特性に合わせてターゲットに最適化することを推奨する.

ストラテジーソースコード
/*backtest
start: 2025-01-21 00:00:00
end: 2025-02-20 00:00:00
period: 1h
basePeriod: 1h
exchanges: [{"eid":"Binance","currency":"ETH_USDT"}]
*/

//@version=6
strategy("Gaussian Channel + Stochastic RSI Filter", overlay=true, margin_long=100, margin_short=100)

// === INPUTS ===
input_length = input.int(100, title="Gaussian Channel Length", minval=1)
input_mult = input.float(2.0, title="Gaussian Channel Multiplier", minval=0.1, step=0.1)
stoch_rsi_period = input.int(14, title="Stochastic RSI Period", minval=1)
stoch_rsi_smoothK = input.int(3, title="Stochastic RSI Smooth K", minval=1)
stoch_rsi_smoothD = input.int(3, title="Stochastic RSI Smooth D", minval=1)
stoch_rsi_overbought = input.float(80.0, title="Stochastic RSI Overbought Level", minval=0, maxval=100)
stoch_rsi_oversold = input.float(20.0, title="Stochastic RSI Oversold Level", minval=0, maxval=100)

// === GAUSSIAN CHANNEL ===
// Gaussian filter calculation with proper initialization
gauss(src, len) =>
    b = math.exp(-1.414 * 3.14159 / len)
    a0 = 1 - b
    var float f = na
    f := na(f[1]) ? src : a0 * src + b * f[1]

// Calculate Gaussian channel
gaussian_channel_mid = gauss(close, input_length)
gaussian_channel_high = gaussian_channel_mid + gaussian_channel_mid * input_mult / 100
gaussian_channel_low = gaussian_channel_mid - gaussian_channel_mid * input_mult / 100

// Plot Gaussian Channel
plot(gaussian_channel_mid, color=color.blue, linewidth=2, title="Gaussian Channel Midline")
plot(gaussian_channel_high, color=color.green, linewidth=1, title="Gaussian Channel Upper Band")
plot(gaussian_channel_low, color=color.red, linewidth=1, title="Gaussian Channel Lower Band")

// === STOCHASTIC RSI ===
k = ta.sma(ta.stoch(close, high, low, stoch_rsi_period), stoch_rsi_smoothK)
d = ta.sma(k, stoch_rsi_smoothD)
is_oversold = k < stoch_rsi_oversold and d < stoch_rsi_oversold
is_overbought = k > stoch_rsi_overbought and d > stoch_rsi_overbought

// Plot Stochastic RSI
hline(stoch_rsi_overbought, "Overbought", color=color.red, linestyle=hline.style_dotted)
hline(stoch_rsi_oversold, "Oversold", color=color.green, linestyle=hline.style_dotted)
plot(k, color=color.blue, title="Stochastic RSI %K")
plot(d, color=color.orange, title="Stochastic RSI %D")

// === ENTRY AND EXIT LOGIC ===
// Long entry: Price crosses above Gaussian Channel lower band and Stochastic RSI is oversold
long_condition = ta.crossover(close, gaussian_channel_low) and is_oversold

// Short entry: Price crosses below Gaussian Channel upper band and Stochastic RSI is overbought
short_condition = ta.crossunder(close, gaussian_channel_high) and is_overbought

// Exit logic
long_exit = ta.crossunder(close, gaussian_channel_mid) or is_overbought
short_exit = ta.crossover(close, gaussian_channel_mid) or is_oversold

// Execute trades
if (long_condition)
    strategy.entry("Long", strategy.long)

if (short_condition)
    strategy.entry("Short", strategy.short)

if (long_exit)
    strategy.close("Long")

if (short_exit)
    strategy.close("Short")

// === SETTINGS ===
// Backtest date range
start_date = timestamp(2023, 1, 1, 0, 0)
end_date = timestamp(2069, 1, 1, 0, 0)
if (time < start_date or time > end_date)
    strategy.close_all()