
2
Follow
478
Followers
概要
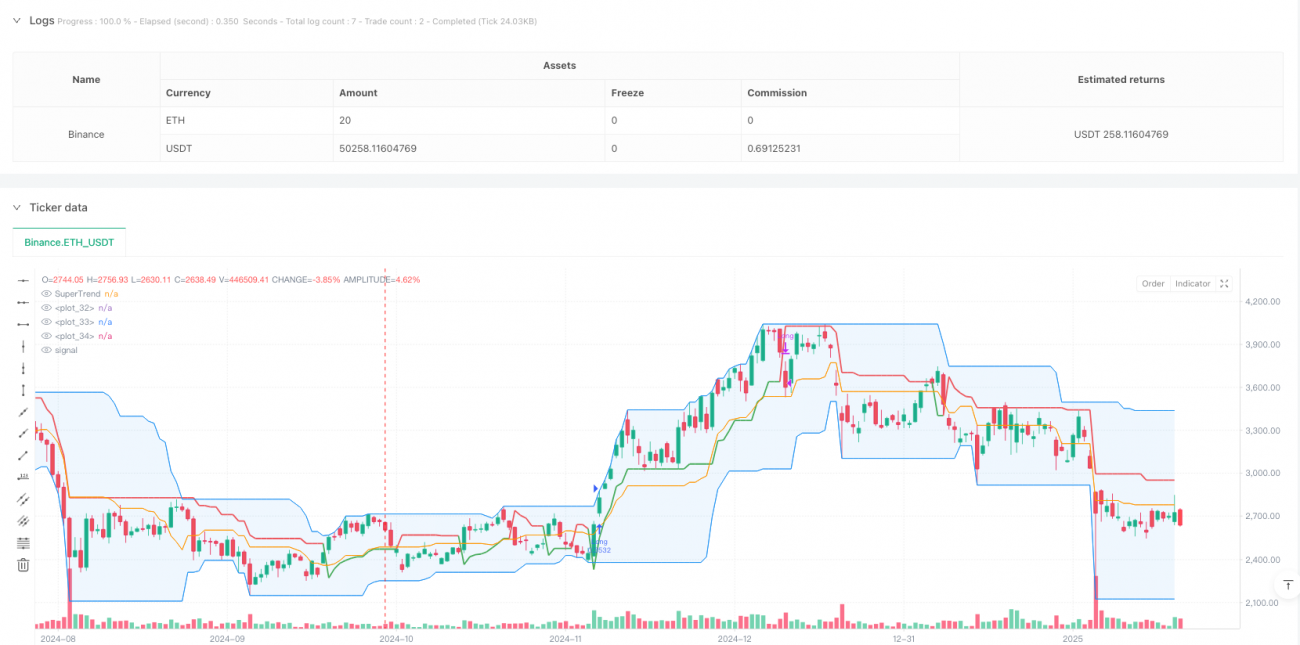
この戦略は,ドンチアンチャネル (Donchian Channel) への突破に基づくトレンド追跡取引システムで,スーパートレンド指標 (SuperTrend) と取引量フィルター (trading volume filter) を組み合わせて取引信号の信頼性を強化している.この戦略は,価格の歴史的な突破高を捕捉することによって潜在的な多頭取引機会を主に識別し,取引量確認とトレンド追跡指標を偽の突破信号をフィルターするために使用する.戦略の設計は柔軟であり,異なる市場環境と取引品種に応じてパラメータ的に最適化することができます.
戦略原則
戦略の中核となるロジックは、次の主要な要素に基づいています。
- 唐<unk>通路:ユーザー定義周期内の最高値と最低値を計算し,上線,下線,中線を形成する.価格が上線を突破すると,多頭入場信号を触発する.
- 取引量フィルター:現在の取引量と20サイクル移動平均を比較して,取引量が増大する時にのみ出場することを保証し,突破の信頼性を高めます.
- 超トレンド指標:トレンド確認ツールとして,多頭トレンドでは緑色,空頭トレンドでは赤色で表示されます.
- 柔軟なストップメカニズム: 下線ストップ,中線ストップ,超トレンドストップ,パーセンテージ・トラッキングストップを含む4つの異なるストップオプションを提供します.
戦略的優位性
- 複数のシグナルの確認:価格の突破,取引量の確認,トレンド指標を組み合わせて,偽の突破のリスクを大幅に軽減します.
- 適応性:パラメータの調整により,異なる市場環境と取引サイクルに適応できます.
- リスク管理の改善:市場特性に応じて最も適したストップ方法を選択できる複数のストップオプションを提供
- ビジュアル化:戦略インターフェースは,市場状況を容易に理解するために,指標を直視的に表示します.
- リベーリングの柔軟性: リベーリングの時間帯をカスタマイズして,戦略を最適化できます.
戦略リスク
- 振動市場のリスク:区間振動の状況で頻繁に偽の突破信号が生じることがあります.
- スライドポイントリスク:流動性が低い市場では,ブレイクシグナルがスライドポイントによって入場価格の偏移を引き起こす可能性がある.
- 過剰フィルタリングの危険性: 取引量フィルタリングを有効にすると,有効な取引機会を逃す可能性があります.
- パラメータの感度: 戦略の効果はパラメータ設定に敏感であり、慎重な最適化が必要です。
戦略最適化の方向性
- トレンド強度フィルターを追加: ADXなどのトレンド強度指標を追加し,トレンドが強いときにのみ入場できます.
- 取引量指標の最適化:相対取引量または取引量突破指標を単純移動平均の代わりとして使用することを考えることができます.
- タイムフィルターを追加:取引時間ウィンドウの設定を追加し,市場の波動が大きい時間を回避します.
- ダイナミックパラメータ最適化:市場の波動率に応じて,経路周期と超トレンドパラメータを自動的に調整する.
- 機械学習の導入:機械学習アルゴリズムを使用してパラメータ選択と信号フィルタリングを最適化する.
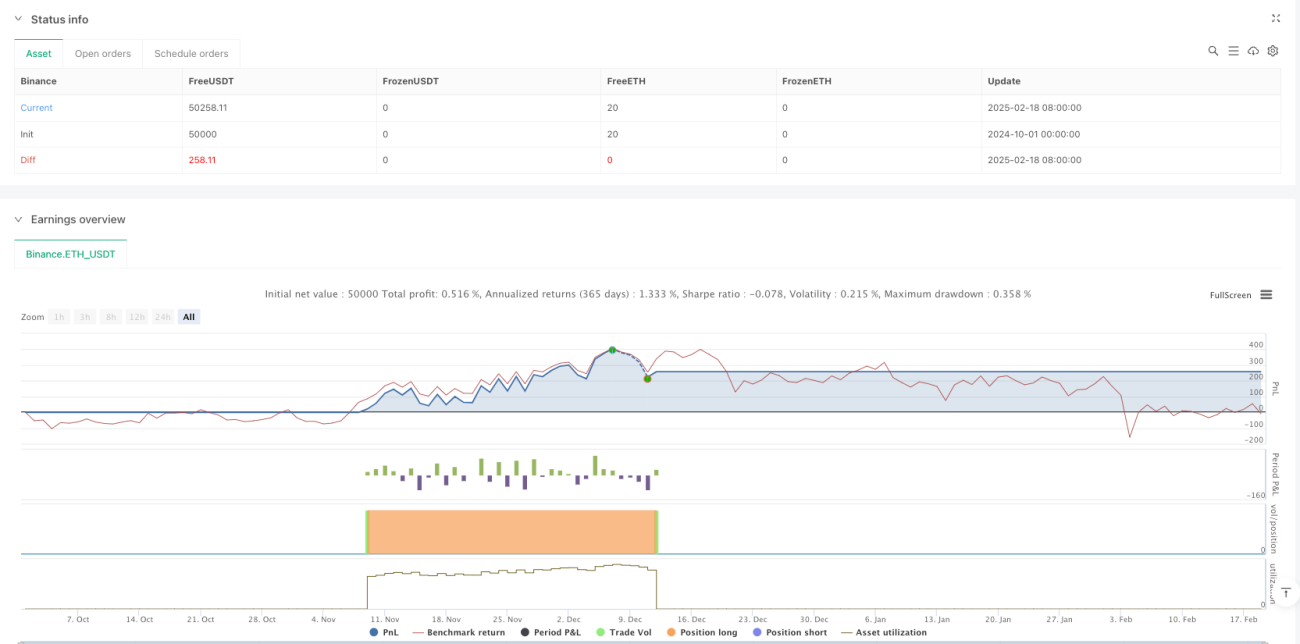
要約する
この戦略は,複数の技術指標を総合的に使用することによって,比較的完ぺきなトレンド追跡取引システムを構築している.この戦略の優点は,信号の信頼性が高いこと,リスク管理の柔軟性にあるが,依然として,特定の市場の特徴に応じてトレーダーによるパラメータの最適化が必要である.この戦略は,継続的な改善と最適化によって,トレンド市場の安定した取引効果を得ることが期待されている.
Source
Pine
Strategy parameters
Related strategies
Comment
All comments (0)
No data
- 1