
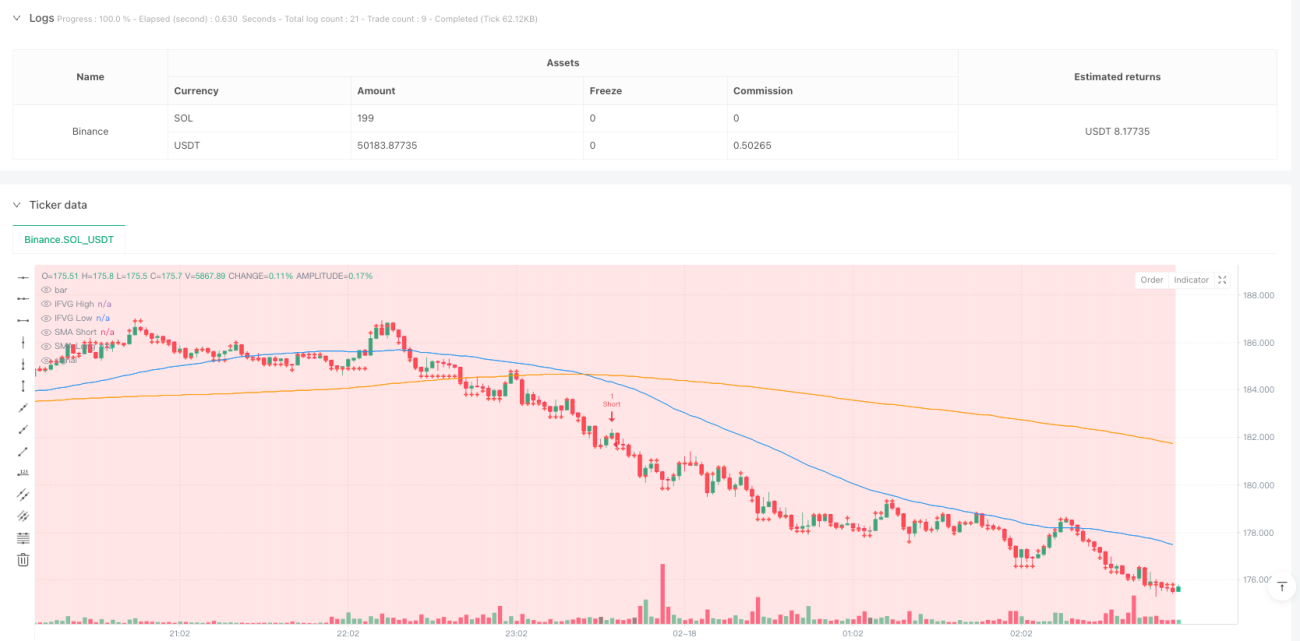
この戦略は,反転フェア・バリュー・ギャップ (IFVG) に基づく定量取引システムで,移動平均のトレンド確認とダイナミック・トラッキング・ストップ・メカニズムを組み合わせている.この戦略は,価格行動におけるフェア・バリュー・ギャップ (FVG) とその反転形状を識別し,トレンドが支持されている場合に取引を行う.この方法は,取引方向が全体的な市場動向と一致していることを保証するだけでなく,市場における重要な反転の転換点を捕捉することができる.
戦略の中核となるロジックには、次の主要なステップが含まれます。
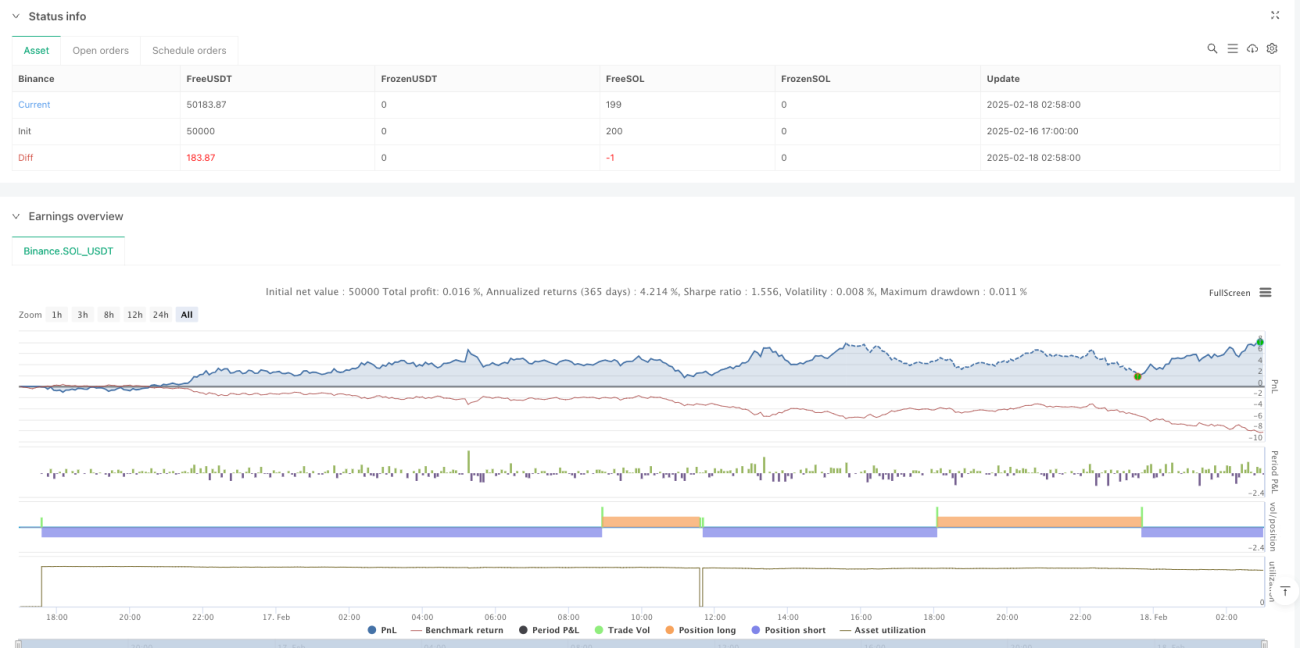
この戦略はIFVGの価格構造,トレンド確認,ダイナミックなリスク管理を組み合わせて,完全な取引システムを構築しています. 戦略は簡潔さを保ちながら,市場トレンド,リスク管理,利益管理などの重要な要素を十分に考慮しています. 戦略は,推奨された最適化の方向によって,その適応性と安定性をさらに高めることができます.
/*backtest
start: 2025-05-31 00:00:00
end: 2025-06-30 00:00:00
period: 1m
basePeriod: 1m
exchanges: [{"eid":"Futures_Binance","currency":"BNB_USDT"}]
args: [["RunMode",1,358374]]
*/
//@version=6
strategy("Inverted FVG Strategy with Trend Check and Trailing Stops", default_qty_value = 10, overlay=true)
// Function to detect FVG
fvgDetected(src, high, low) =>
float prevHigh = na
float prevLow = na
float prevClose = na
float fvgHigh = na
float fvgLow = na
bool fvg = false
if (not na(src[3]))
prevHigh := high[3]
prevLow := low[3]
prevClose := src[3]
if (src[2] > prevClose and low[2] > prevHigh) or (src[2] < prevClose and high[2] < prevLow)
fvg := true
fvgHigh := low[2] > prevHigh ? high[2] : na
fvgLow := high[2] < prevLow ? low[2] : na
[fvg, fvgHigh, fvgLow]
// Detect FVG on the chart
[fvg, fvgHigh, fvgLow] = fvgDetected(close, high, low)
// Detect IFVG - Inversion of FVG
bool ifvg = false
float ifvgHigh = na
float ifvgLow = na
if (fvg)
if (high[1] > fvgHigh and close[1] > open[1]) or (high[1] < fvgLow and close[1] < open[1])
ifvg := true
ifvgHigh := close[1] > open[1] ? high[1] : na
ifvgLow := close[1] < open[1] ? low[1] : na
// Plot FVG and IFVG zones for visualization
plot(ifvgHigh, title="IFVG High", color=color.red, linewidth=2, style=plot.style_cross)
plot(ifvgLow, title="IFVG Low", color=color.red, linewidth=2, style=plot.style_cross)
// Trend Check using Simple Moving Averages
smaShort = ta.sma(close, 50) // Short term SMA
smaLong = ta.sma(close, 200) // Long term SMA
bool uptrend = false
bool downtrend = false
uptrend := smaShort > smaLong // Up trend if short SMA is above long SMA
downtrend := smaShort < smaLong // Down trend if short SMA is below long SMA
// Plot SMAs for visualization
plot(smaShort, title="SMA Short", color=color.blue, linewidth=1)
plot(smaLong, title="SMA Long", color=color.orange, linewidth=1)
// Trading logic with trend confirmation
longCondition = ifvg and close < ifvgLow and uptrend
shortCondition = ifvg and close > ifvgHigh and downtrend
// Risk Definition - 使用百分比
stopLoss = 0.005 // 0.5% 止损
takeProfit = 0.015 // 1.5% 止盈
if (longCondition and strategy.position_size == 0)
strategy.entry("Long", strategy.long)
stopPrice = close * (1 - stopLoss)
limitPrice = close * (1 + takeProfit)
strategy.exit("Initial Long Exit", "Long", stop=stopPrice, limit=limitPrice)
if (shortCondition and strategy.position_size == 0)
strategy.entry("Short", strategy.short)
stopPrice = close * (1 + stopLoss)
limitPrice = close * (1 - takeProfit)
strategy.exit("Initial Short Exit", "Short", stop=stopPrice, limit=limitPrice)
// ATR for dynamic trailing stop
atr = ta.atr(14)
// Trailing Stop for Long Position if the trade has moved > 0.5% (half of takeProfit)
if (strategy.position_size > 0)
profitThreshold = takeProfit * 0.5 // 1.5% profit threshold
if (close - strategy.position_avg_price >= strategy.position_avg_price * profitThreshold)
// 将止损移动到盈亏平衡点加上一点利润
trailingStopLong = math.max(strategy.position_avg_price * (1 + profitThreshold), close - (atr * 2))
strategy.exit("Trailing Stop Long", "Long", stop=trailingStopLong)
// Trailing Stop for Short Position if the trade has moved > 0.5% (half of takeProfit)
if (strategy.position_size < 0)
profitThreshold = takeProfit * 0.5 // 1.5% profit threshold
if (strategy.position_avg_price - close >= strategy.position_avg_price * profitThreshold)
// 将止损移动到盈亏平衡点加上一点利润
trailingStopShort = math.min(strategy.position_avg_price * (1 - profitThreshold), close + (atr * 2))
strategy.exit("Trailing Stop Short", "Short", stop=trailingStopShort)