
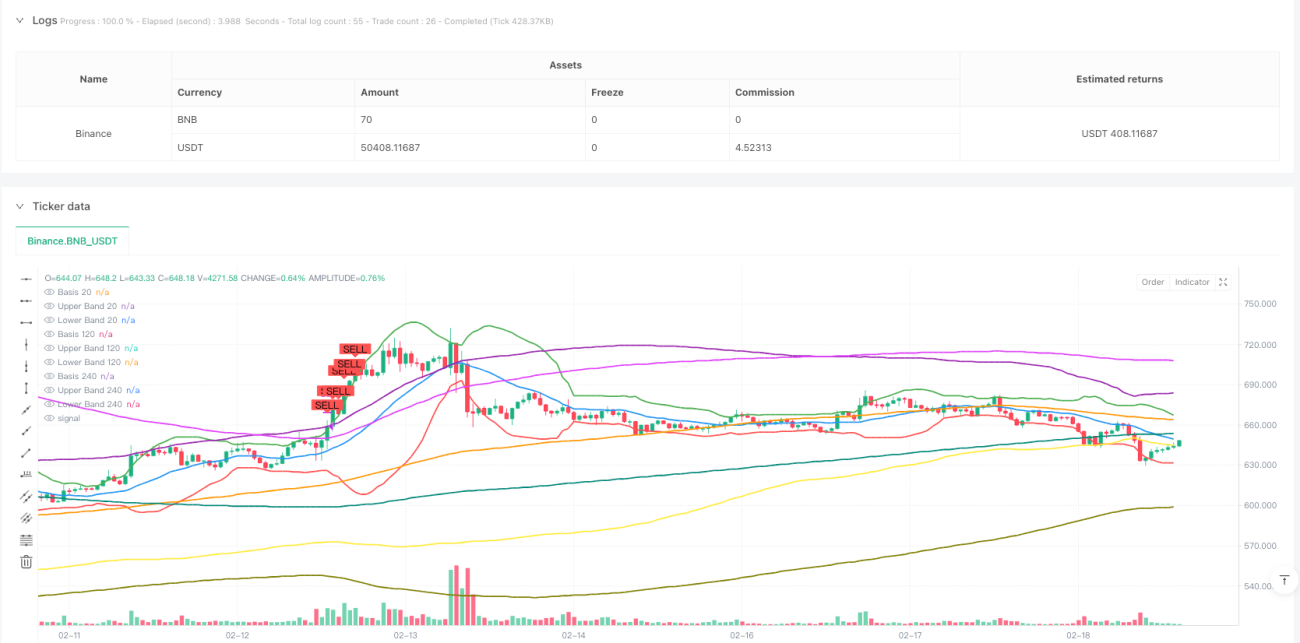
これは,トリプルブリン帯をベースにしたトレンド追跡戦略である.この戦略は,異なる周期 ([20],[120],[241]) のブリンを組み合わせて,市場の過買過売状態を識別し,価格が3つのブリン帯を突破したときに取引シグナルを生成する.この多周期ブリン帯の組み合わせは,偽の信号を効果的にフィルターし,取引の正確性を向上させる.
戦略は,3つの異なる周期のブリン帯 ((20・120・240周期),各ブリン帯は中軌 ((SMA) と上下軌 ((標準差の2倍) で構成されている. 価格が同時に3つのブリン帯の下軌を突破すると,市場が過剰売りが発生する可能性を示し,システムは複数の信号を発信する. 価格が同時に3つのブリン帯の上軌を突破すると,市場が過剰買いが発生する可能性を示し,システムは平仓信号を発信する.
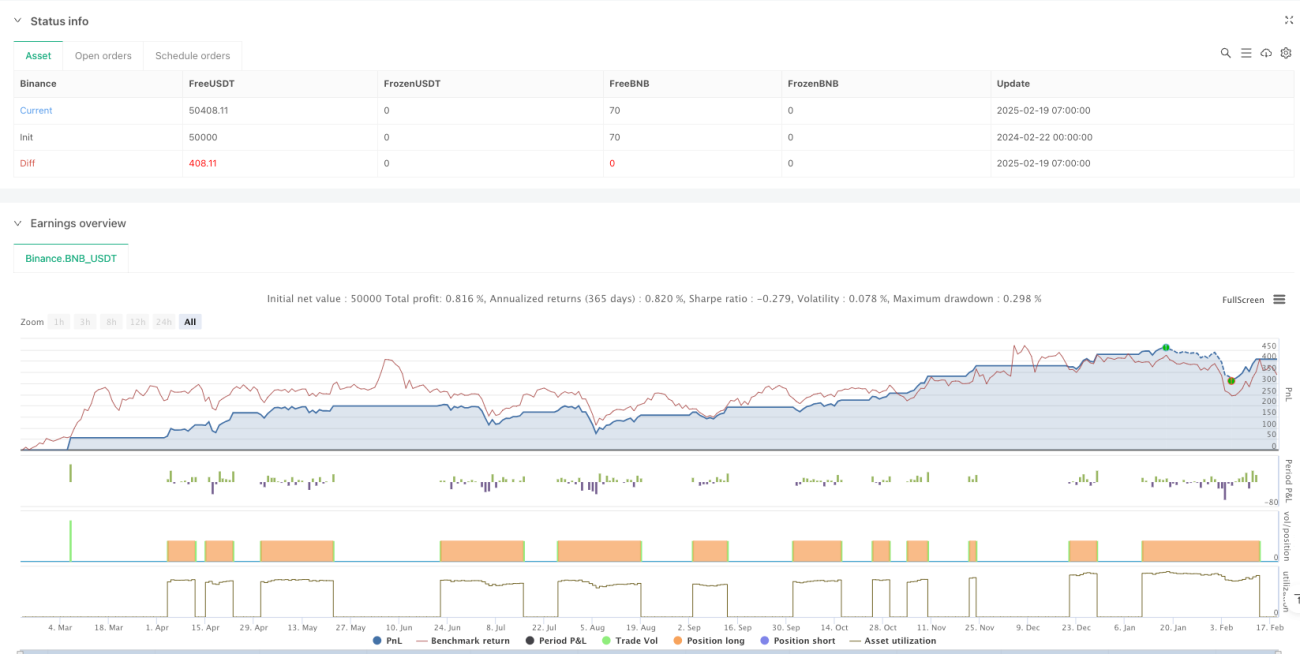
これは,多周期ブリン帯に基づくトレンド追跡戦略で,トリプルブリン帯の交差によって取引信号が確認され,より高い信頼性と適応性がある.戦略の核心的な優位性は,複数の確認機構と明確なリスク管理システムにあるが,波動的な市場におけるパフォーマンスとパラメータ最適化の問題にも注意する必要がある.価格関係分析,ストップメカニズムの改善,動態パラメータ調整などの最適化方向を加えることで,戦略の安定性と収益性をさらに向上させることができる.
/*backtest
start: 2024-02-22 00:00:00
end: 2025-02-19 08:00:00
period: 1h
basePeriod: 1h
exchanges: [{"eid":"Binance","currency":"BNB_USDT"}]
*/
//@version=5
strategy(title="Bollinger Bands Strategy (Buy Below, Sell Above)", shorttitle="BB Strategy", overlay=true)
// Bollinger Bands parameters
length1 = input(20, title="BB Length 20")
mult1 = input(2.0, title="BB Multiplier 20")
length2 = input(120, title="BB Length 120")
mult2 = input(2.0, title="BB Multiplier 120")
length3 = input(240, title="BB Length 240")
mult3 = input(2.0, title="BB Multiplier 240")
// Calculate the basis (simple moving average) and deviation for each Bollinger Band
basis1 = ta.sma(close, length1)
dev1 = mult1 * ta.stdev(close, length1)
upper1 = basis1 + dev1
lower1 = basis1 - dev1
basis2 = ta.sma(close, length2)
dev2 = mult2 * ta.stdev(close, length2)
upper2 = basis2 + dev2
lower2 = basis2 - dev2
basis3 = ta.sma(close, length3)
dev3 = mult3 * ta.stdev(close, length3)
upper3 = basis3 + dev3
lower3 = basis3 - dev3
// Buy Condition: Price is below all three lower bands
buyCondition = close < lower1 and close < lower2 and close < lower3
// Sell Condition: Price is above all three upper bands
sellCondition = close > upper1 and close > upper2 and close > upper3
// Plot Buy and Sell signals with arrows
plotshape(buyCondition, style=shape.labelup, location=location.belowbar, color=color.green, text="BUY", size=size.small)
plotshape(sellCondition, style=shape.labeldown, location=location.abovebar, color=color.red, text="SELL", size=size.small)
// Strategy orders for buy and sell
if (buyCondition)
strategy.entry("Buy", strategy.long)
if (sellCondition)
strategy.close("Buy") // Close the long position for a sell signal
// Plotting the Bollinger Bands without filling the area
plot(basis1, color=color.blue, title="Basis 20", linewidth=2)
plot(upper1, color=color.green, title="Upper Band 20", linewidth=2)
plot(lower1, color=color.red, title="Lower Band 20", linewidth=2)
plot(basis2, color=color.orange, title="Basis 120", linewidth=2)
plot(upper2, color=color.purple, title="Upper Band 120", linewidth=2)
plot(lower2, color=color.yellow, title="Lower Band 120", linewidth=2)
plot(basis3, color=color.teal, title="Basis 240", linewidth=2)
plot(upper3, color=color.fuchsia, title="Upper Band 240", linewidth=2)
plot(lower3, color=color.olive, title="Lower Band 240", linewidth=2)