
2
Follow
478
Followers
概要
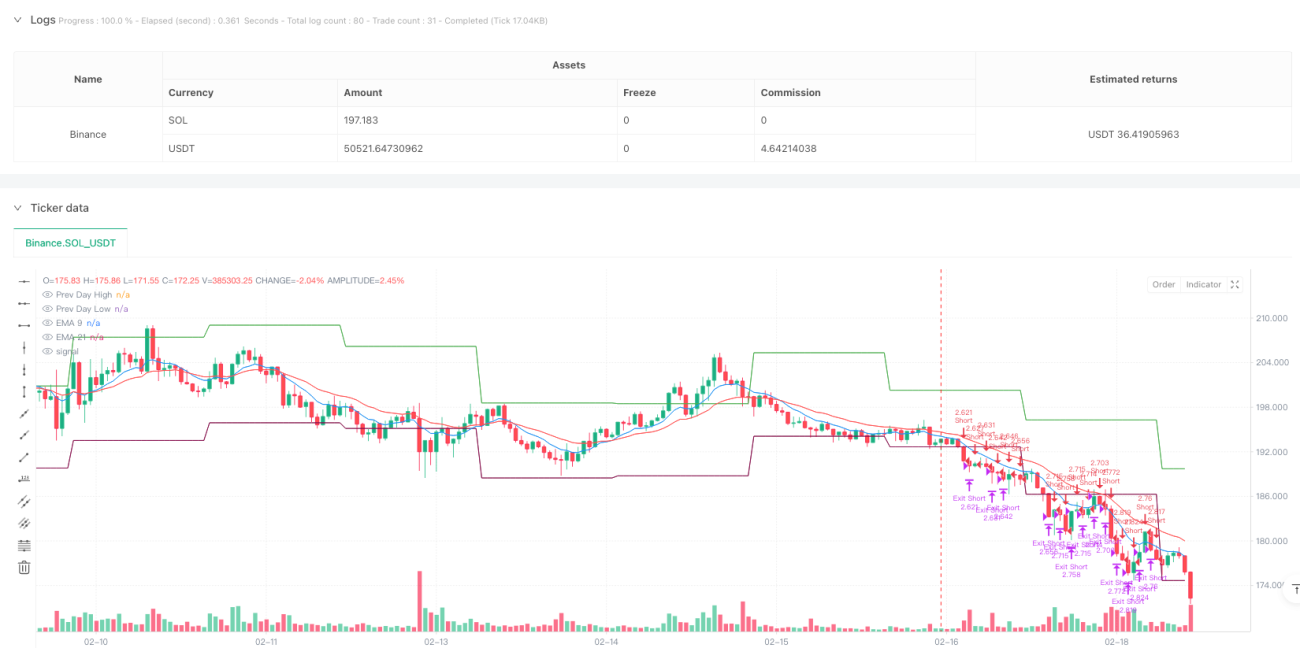
この戦略は,前日の価格区間突破と指数移動平均 ((EMAs)) を組み合わせた日内取引戦略である.この戦略は,価格突破の前の取引日の高点または低点のタイミングを識別し,急速および遅いEMAsの確認シグナルと組み合わせて取引する.この戦略は,短期価格の動きを捕捉し,固定ストップポイント数とリスク・リターン比率を設定することによってリスクを管理することに焦点を当てている.
戦略原則
戦略の中核となるロジックは、次の主要な要素に基づいています。
- request.security関数を使用して,前日の高点と低点を鍵値区間として取得します.
- 9周期と21周期の指数移動平均 ((EMAs) をトレンド確認指標として計算する.
- 価格突破の1日前の高点で,急速なEMAが遅いEMAの上にあるとき,多信号をトリガーする.
- 価格が急激なEMAを下回っている時,急激なEMAが急激なEMAを下回っている時,空調信号を発動します.
- 固定のストップ・ロスポイント ((30ポイント) とリスク・リターン比率 ((2.0) を設定することで,各取引のリスクを管理する.
- 選択可能な取引時間フィルタ機能,特定の時間帯 (SASTタイムゾーン) で取引をサポートする.
戦略的優位性
- 構造が明確で,論理がシンプル:戦略は,理解し,実行しやすい価格突破の論理を使用する.
- リスク管理の改善: 固定ストップポイント数とリスク・リターン比率の設定により,厳格なリスク管理を実現.
- 柔軟な時間管理:選択可能な取引時間フィルタ機能により,最も活発な市場時に取引が可能です.
- 多重確認メカニズム:価格突破とEMAのトレンド確認を組み合わせて,偽信号のリスクを低減する.
- 高度な自動化: 戦略の実行は完全に自動化され,人間の介入は少なくなります.
戦略リスク
- 偽の突破リスク: 価格が突破後に急激に後退し,ストップ・ロスの出場を引き起こす可能性がある.
- スライドポイントリスク:高波動期には,実際の取引価格がシグナル価格から著しく偏っている可能性があります.
- 固定ストップリスク: 固定ポイントのストップは,すべての市場条件に適合しない可能性があります.
- 市場波動のリスク:低波動期に過剰な取引シグナルが生じる可能性があります.
戦略最適化の方向性
- ダイナミック・ストップ・損失最適化:市場の変動率に合わせてストップ・損失ポイントの動的調整を考慮することができる.
- 取引時間最適化: 取引時間ウィンドウの設定を最適化するために,過去データ分析を行います.
- 信号フィルタリング強化: 交差量または波動率の指標を追加して追加フィルタリング条件として.
- EMAsのパラメータ最適化:回測によって最適のEMAs周期設定を決定する.
- ポジション管理の最適化:変動率に基づく動的ポジション管理機構の導入.
要約する
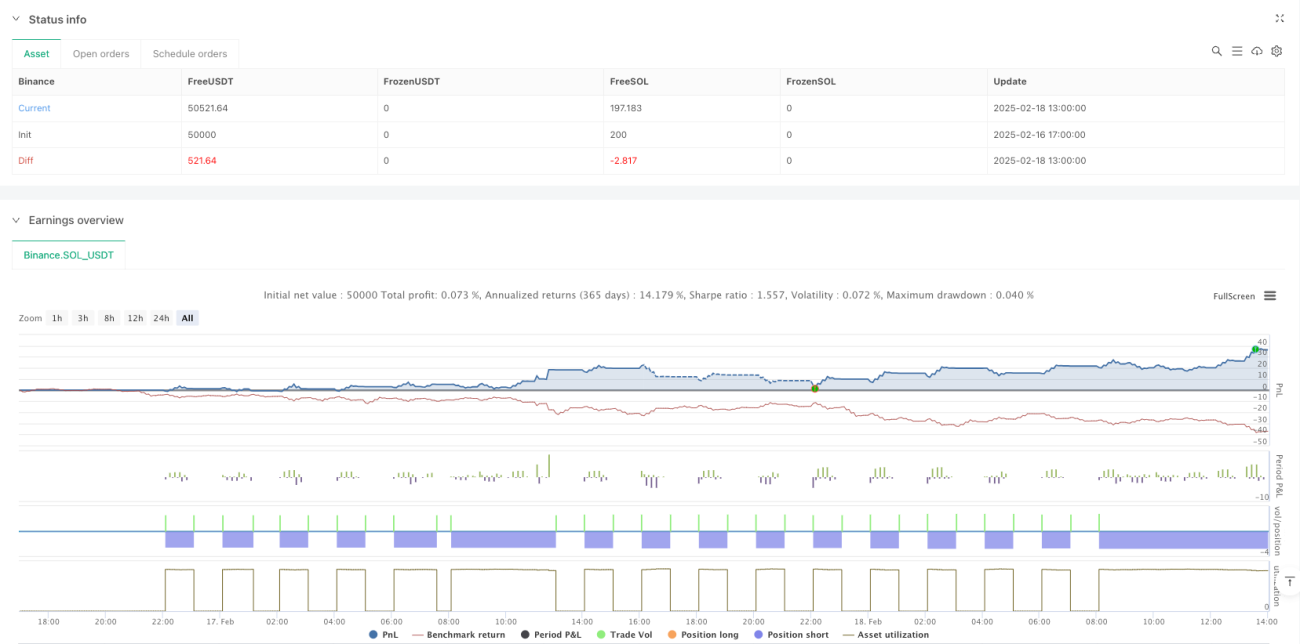
この戦略は,価格の突破とEMAsのトレンド確認を組み合わせた方法で,信頼性の高い日内取引システムを実現する.戦略の核心的な優位性は,その明確な論理構造と完善したリスク管理機構にある.戦略は,推奨された最適化方向によって,その安定性と収益性をさらに向上させることができる.実際の取引では,偽突破と滑り場リスクに特に注意を払い,実際の市場条件に応じてパラメータを調整する必要があります.
Source
Pine
/*backtest
start: 2025-02-16 17:00:00
end: 2025-02-18 14:00:00
period: 1h
basePeriod: 1h
exchanges: [{"eid":"Binance","currency":"SOL_USDT"}]
*/

//@version=5
strategy("GER40 Momentum Breakout Scalping", overlay=true, initial_capital=10000, default_qty_type=strategy.percent_of_equity, default_qty_value=1)

//———— Input Parameters —————Strategy parameters
Related strategies
Comment
All comments (0)
No data
- 1