2
フォロー
455
フォロワー
概要
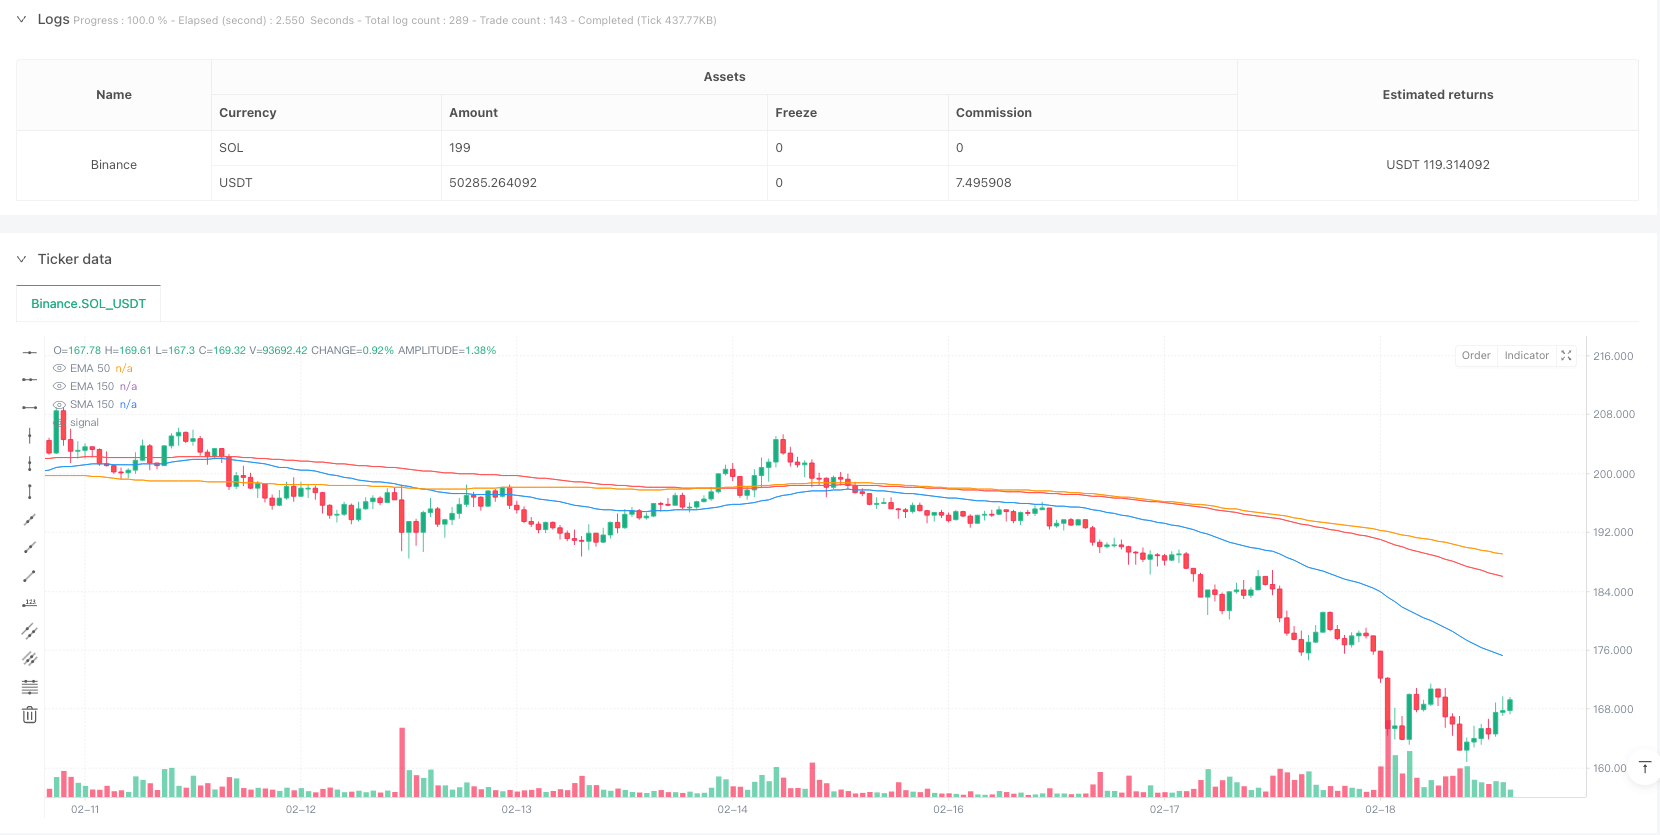
この戦略は,指数移動平均 (EMA) とシンプル移動平均 (SMA) を組み合わせたトレンド追跡取引システムである.この戦略は,主にEMA50とEMA150の交差を活用して取引信号を生成し,SMA150をストップラインとして使用し,ストップ後に再入場メカニズムを含む.この設計は,中長期のトレンドを捕捉し,リスクを効果的に管理する.
戦略原則
戦略の中核となるロジックには、次の重要な要素が含まれます。
- 入場信号:EMA50が上向きにEMA150を横切るときは多行信号を生成し,EMA50が下向きにEMA150を横切るときは空行信号を生成する.
- ストップ・ロズメカニズム:価格がSMA150を下回るとストップ・ロズメ平仓を触発する.
- 再入場メカニズム:ストップを触発した後に,価格が再びEMA150を突破した場合,再入場を行う.EMA50が再びEMA150を突破した場合,入場を空にする.
- 取引実行: 戦略は,0.1%の手数料と3ポイントのスライドポイントを考慮して,指定された時間枠で取引を実行します.
戦略的優位性
- トレンド追跡能力:異なる周期の平均線組み合わせを使用して,市場トレンドを効果的に捉えることができる.
- リスク管理の改善: 明確なストップ・ロスの条件を設定し,過大な損失を避ける.
- 再入場機は柔軟で,市場状況が改善されたときに再入場を許可し,収益の機会を向上させる.
- パラメータ設定は合理的:EMA50とEMA150の周期選択は,感度と安定性をバランスする.
- 実際の取引コストを考慮する: 取引手数料とスライドポイントの要素を含み,実際の取引環境に近い.
戦略リスク
- 振動市場のリスク:横盤振動市場の場合,偽の突破シグナルが頻繁に発生する可能性があります.
- 遅滞のリスク:移動平均指標自体は遅滞しており,最適な入場時間を逃す可能性があります.
- 再入場リスク:急激な波動のある市場では,再入場メカニズムが連続的なストップ損失を引き起こす可能性があります.
- 資金管理リスク:戦略には特定のポジション管理プログラムが含まれていません.
- 市場環境依存:戦略は異なる市場サイクルで大きく異なる.
戦略最適化の方向性
- 波動率指標の導入:ATRまたはBollinger Bandsを追加して,ストップポジションを調整して,ストップをより適応的にすることができる.
- ポジション管理の改善:変動率に基づくダイナミックなポジション管理システムを導入することを提案する.
- 再入場条件の最適化:RSIなどの振動指標と組み合わせて,再入場信号の正確性を向上させることができる.
- 市場環境のフィルタリングを増やす:トレンドの強さの指標を追加し,トレンドの低い市場での取引頻度を減らす.
- 適応パラメータの開発:市場変動に応じて均線周期を動的に調整することができる.
要約する
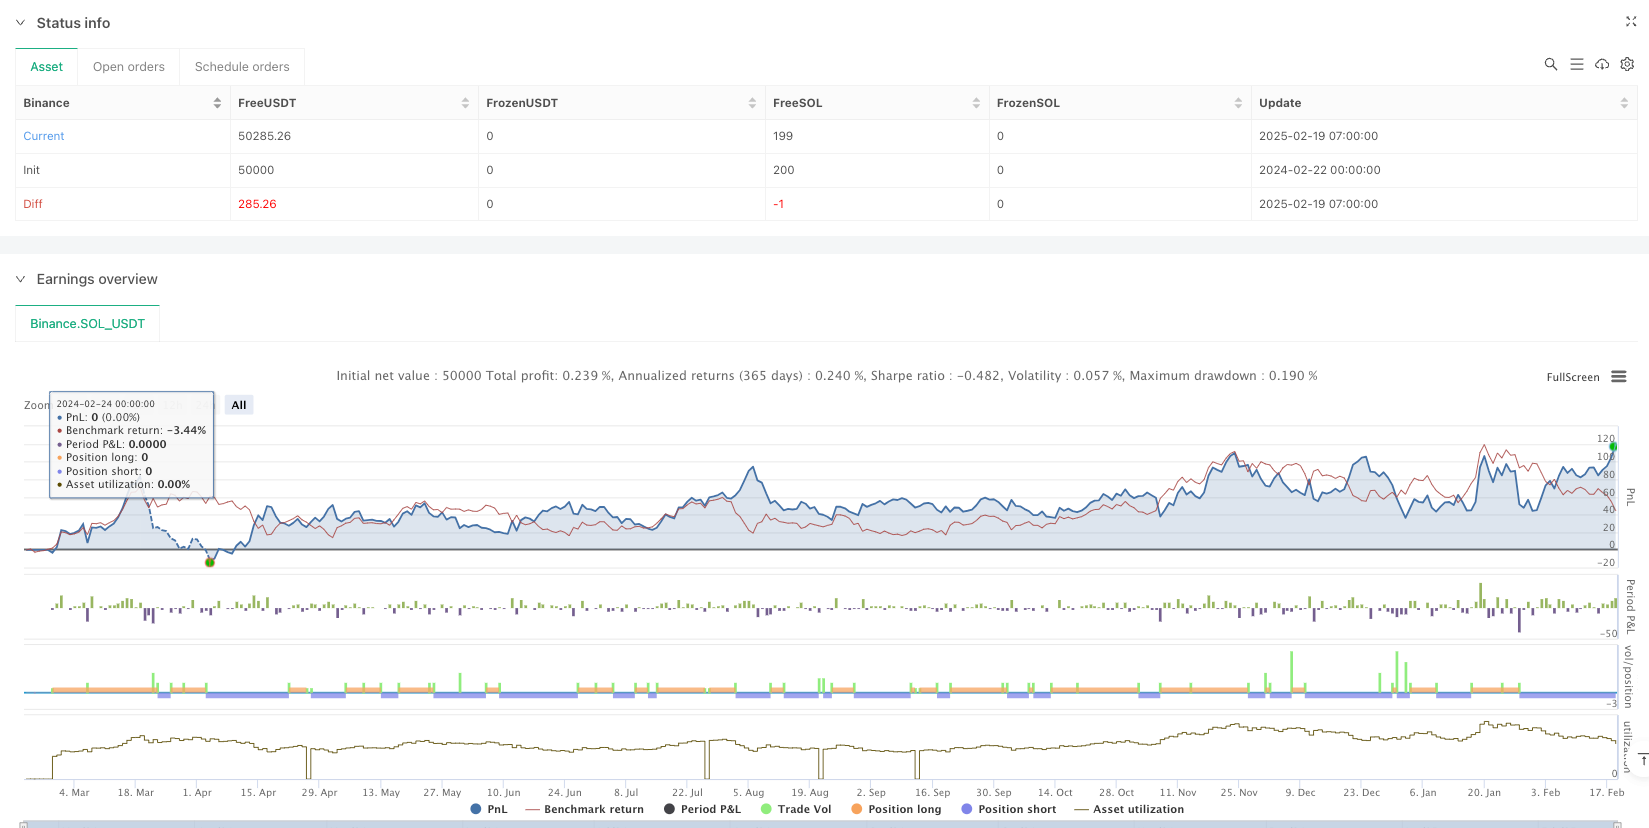
これは,合理的に設計されたトレンド追跡戦略で,均線交差でトレンドを捕捉し,完善したリスク制御機構を備えている.戦略の主な優位性は,システムのトレンド追跡能力とリスク管理設計にあるが,実用化においては,市場環境が戦略のパフォーマンスに与える影響を注意する必要がある.提案された最適化方向によって,戦略はさらに向上する余地がある.
ストラテジーソースコード
/*backtest
start: 2024-02-22 00:00:00
end: 2025-02-19 08:00:00
period: 1h
basePeriod: 1h
exchanges: [{"eid":"Binance","currency":"SOL_USDT"}]
*/

//@version=6
strategy("EMA 50 and EMA 150 with SMA150 Stop-loss and Re-Entry #ganges", overlay=true, commission_type=strategy.commission.percent, commission_value=0.1, slippage=3)


// EMA and SMA Calculations
ema50 = ta.ema(close, 50)
ema150 = ta.ema(close, 150)
sma150 = ta.sma(close, 150)

// Conditions for Buy, Sell, and Stop-Loss
ema50CrossAboveEMA150 = ta.crossover(ema50, ema150)  // Buy signal
ema50CrossBelowEMA150 = ta.crossunder(ema50, ema150) // Sell signal
priceCrossAboveEMA150 = ta.crossover(close, ema150) // Price crosses EMA 150 from below
priceCloseBelowSMA150 = close < sma150              // Stop-loss for long positions


// Track stop-loss hit state
var bool stopLossHit = false

// Strategy Logic
// Buy Logic: EMA 50 crosses EMA 150 from below
if ema50CrossAboveEMA150
    strategy.entry("Buy Signal", strategy.long, qty=1)
    stopLossHit := false // Reset stop-loss state when a new buy position is opened

// Sell Logic: EMA 50 crosses EMA 150 from above
if ema50CrossBelowEMA150
    strategy.entry("Sell Signal", strategy.short, qty=1)
    stopLossHit := false // Reset stop-loss state when a new sell position is opened

// Stop-Loss for Long Positions: Close if price falls below SMA 150
if strategy.position_size > 0 and priceCloseBelowSMA150
    strategy.close("Buy Signal")
    stopLossHit := true // Mark stop-loss hit

// Re-Entry Logic After Stop-Loss
if stopLossHit
    if priceCrossAboveEMA150 // Re-buy logic: PRICE crosses EMA 150 from below
        strategy.entry("Re-Buy Signal", strategy.long, qty=1)
        stopLossHit := false // Reset stop-loss state after re-entry
    if ema50CrossBelowEMA150 // Re-sell logic: EMA 50 crosses EMA 150 from above
        strategy.entry("Re-Sell Signal", strategy.short, qty=1)
        stopLossHit := false // Reset stop-loss state after re-entry

// Plot EMA and SMA Lines
plot(ema50, color=color.blue, title="EMA 50")
plot(ema150, color=color.red, title="EMA 150")
plot(sma150, color=color.orange, title="SMA 150")


// // Calculate Recent All-Time High
// highestHigh = ta.highest(high, 500) // Lookback period of 500 bars
// percentageFall = ((highestHigh - close) / highestHigh) * 100

// // Display Percentage Fall on the Most Recent Candle Only
// isLastBar = bar_index == ta.max(bar_index)
// if isLastBar
//     labelText = str.tostring(percentageFall, "#.##") + "% Fall from ATH"
//     labelPosition = high + ta.atr(14) * 2 // Positioning label above the candle
//     label.new(bar_index, labelPosition, labelText, color=color.red, textcolor=color.white, size=size.small, style=label.style_label_down)