
2
Follow
478
Followers
概要
この戦略は,RSI (比較的強い指標) とトレンド平均線を組み合わせた二重フィルタリングの取引システムである.この戦略は,RSIの超買い超売りシグナルと長期トレンド平均線を組み合わせて,日線レベルで取引する.この戦略の核心は,取引の正確性と信頼性を高めるために,従来のRSI取引シグナルに基づいてトレンドフィルターを追加することです.
戦略原則
戦略は主に以下のコアコンポーネントに基づいています.
- RSIは,14サイクルで超買い超売りを識別します.
- オーバーバイは70で,オーバーセールは30です.
- 傾向フィルターとして200周期単行移動平均
- 購入条件: RSIが超売り区域から上昇し,価格が平均線上にある
- 販売条件: RSIが超買い区域から下方へ突破し,価格が平均線以下である
戦略は,信号が表示されるたびに自動的に取引を実行し,リマインダー機能を設定できます.
戦略的優位性
- 双重確認メカニズムは取引の信頼性を大幅に高めています.
- トレンドと動力の指標を組み合わせて,偽信号のリスクを低減する
- 完全に自動化された取引実行システム
- フレキシブルなパラメータ設定により,戦略を最適化できます.
- リアルタイムのリマインダー機能が組み込まれています.
- 取引信号を明確に表示するビジュアルインタフェース
- フォローバック機能がサポートされ,戦略の検証が容易になります.
戦略リスク
- 市場が揺れ動いていると,頻繁に取引が起こる可能性がある.
- トレンドの転換点は遅れる可能性がある
- 不適切なパラメータ設定は戦略のパフォーマンスに影響を与える可能性があります
- 市場が極端に波動すると,大きな引き下がりが起こりうる.
リスク管理には以下の方法が推奨されています.
- ストップ・ロスを合理的に設定する
- ポジションのサイズを適切に調整する
- 定期的な最適化策のパラメータ
- 他の技術指標と組み合わせた 補助判断
戦略最適化の方向性
- 波動率のフィルターを追加し,波動率が高い時期に取引基準を調整する
- 市場状況に応じてパラメータを動的に調整する自己適応パラメータメカニズムを導入
- 信号の信頼性を向上させるために音量確認メカニズムを追加
- より複雑な出場メカニズムを開発し,締め切りを最適化
- 統合されたマルチタイムサイクル分析により,より包括的な市場見通しを提供
要約する
この戦略は,RSIとトレンド均線を組み合わせて,安定した取引システムを構築している.戦略の設計は合理的で,操作規則は明確で,優れた実用性がある.合理的なリスク管理と継続的な最適化により,この戦略は,実際の取引で安定した収益を期待している.
Source
Pine
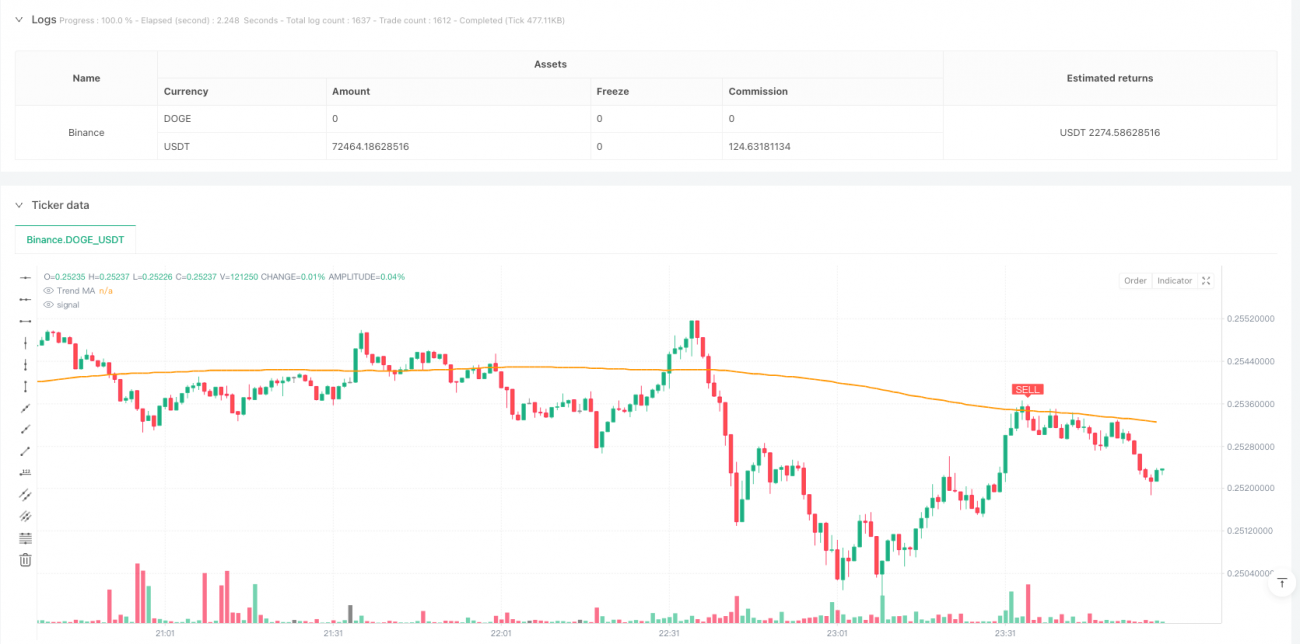
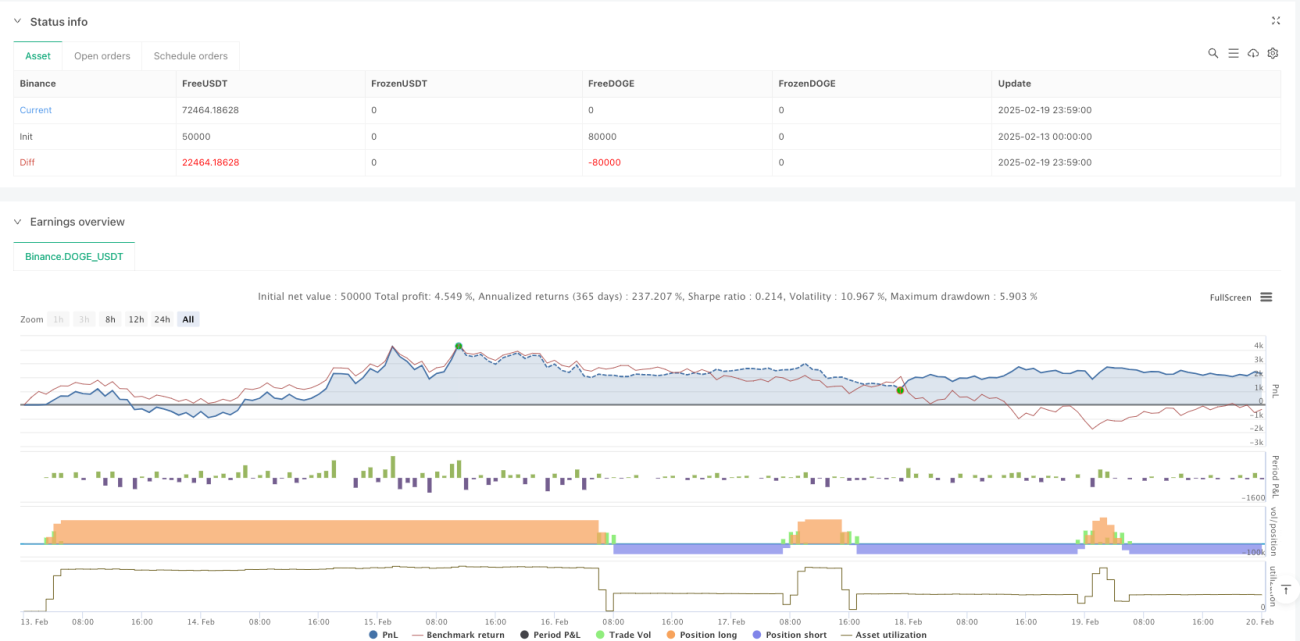
/*backtest
start: 2025-02-13 00:00:00
end: 2025-02-20 00:00:00
period: 1m
basePeriod: 1m
exchanges: [{"eid":"Binance","currency":"DOGE_USDT"}]
*/

//@version=5
strategy("Leading Indicator Strategy – Daily Signals", overlay=true,
     pyramiding=1, initial_capital=100000,
default_qty_type=strategy.percent_of_equity, default_qty_value=100)Strategy parameters
Related strategies
Comment
All comments (0)
No data
- 1