2
フォロー
451
フォロワー
概要
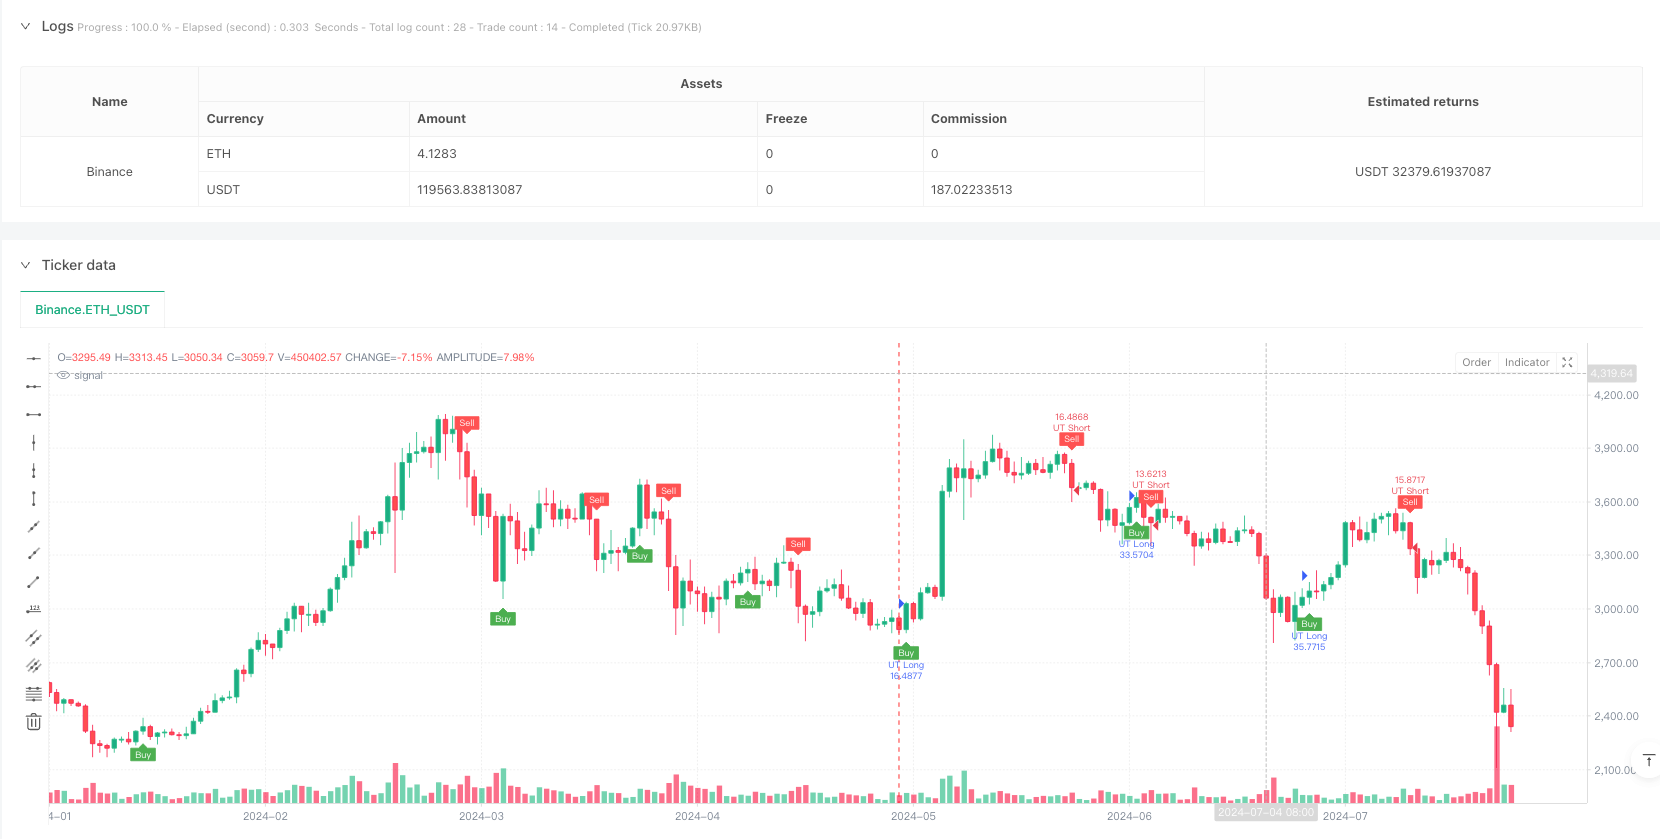
これは,ATR (平均真範囲) 指標に基づくトレンド追跡戦略で,ダイナミックストップと均線交差信号を組み合わせている.この戦略はATRを計算して市場の変動を決定し,この情報を使用してダイナミックストップを設定する.価格とEMA (移動平均) がATRトラッキングストップラインを破るとき,取引信号を生成する.この戦略は,通常のK線または平安K線を使用して計算するオプションも提供しており,戦略の柔軟性を高めています.
戦略原則
戦略の核心的な論理は,以下のいくつかの重要な計算に基づいています.
- ATR指標を用いて市場の波動性を測定し,周期を調整できる
- ATR 値に基づいて動的停止距離を計算し,感度パラメータ a によって調整する
- 価格の動きに動的に調整するストップラインをATRに構築する
- 1サイクルEMAとATRのストップラインの交差点を用いて取引信号を決定する
- EMAはATRの追跡停止線を上方突破する際に多開,下方突破する際に空開
- 計算基準として,通常の閉盘価格または平安K線のHLC3価格を使用するオプション
戦略的優位性
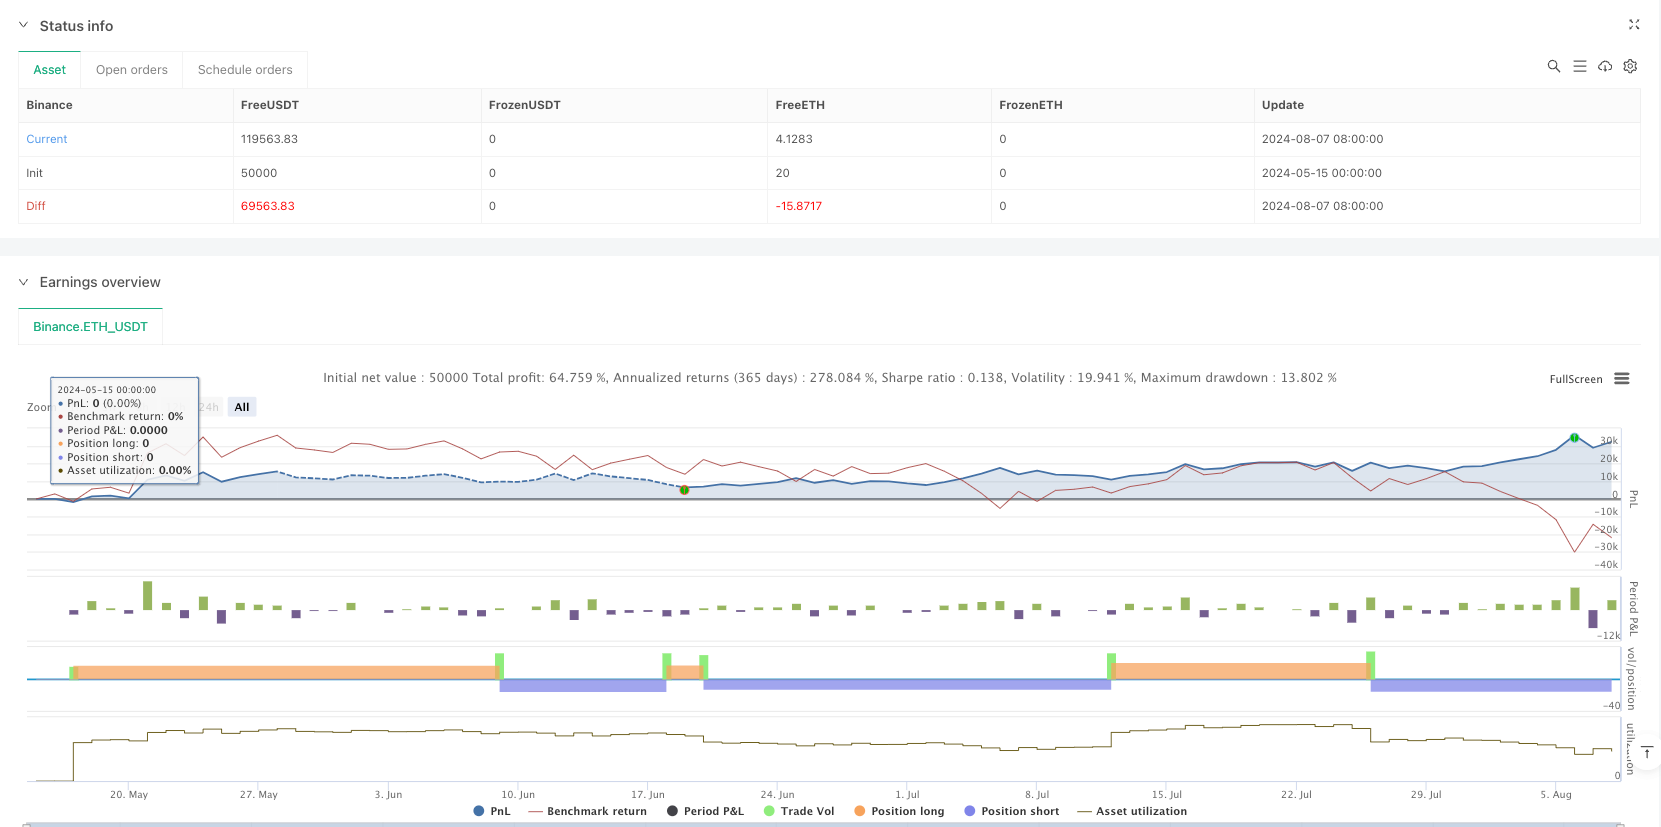
- ダイナミックな適応性:ATRのトラッキングストップは,市場の変動に応じて自動的に調整され,異なる市場環境で戦略が安定性を保つことができます.
- リスク管理の改善:ダイナミック・ストップ・ラインによるポジションの継続的な保護
- パラメータの調整性:ATR周期と感度を調整することで,異なる市場特性に適応できます.
- 信号は明瞭で信頼性がある:均線交差を組み合わせて,明確な出入場信号を提供する
- 計算論理の簡潔性: 戦略論理が明確で,理解し,維持しやすい
- グラフィカルな取引信号とトレンドの表示
戦略リスク
- 横盤の振動で頻繁に偽のブレイクシグナルが生じる可能性
- スライドポイントの影響: 急速な状況下では,戦略のパフォーマンスに影響を与える大きなスライドポイントに直面する可能性があります.
- パラメータ感度: 異なるパラメータの組み合わせにより、戦略のパフォーマンスに大きな違いが生じる可能性があります。
- トレンド依存性: この戦略はトレンドのない市場ではうまく機能しない可能性があります
- 止損幅度:ATR値が異動すると,止損位置が不合理になる可能性がある
戦略最適化の方向性
- トレンドフィルターを増やす: トレンド判断の追加指標を導入し,波動市場の偽信号を減らす
- オプティマイゼーションパラメータの自己適応:ATR周期と感度を自動的に最適化するメカニズムの開発
- 信号確認の改善: 取引量または他の技術指標を信号確認として増やす
- 完善したストップメカニズム:ATRに基づく固定ストップと移動ストップの組み合わせ
- ポジション管理を増やす:市場の変動動向に応じてポジションの規模を調整する
要約する
これは,ダイナミックなストップ・ローズと均線システムを組み合わせた完全な取引戦略である.ATR指標によって市場の波動特性を捉え,均線交差を利用して取引シグナルを提供し,論理的に厳格な取引システムを形成する.戦略の優位性は,そのダイナミックな適応性とリスク管理能力にあるが,横軸市場のパフォーマンスにも注意する必要がある.推奨された最適化方向によって,戦略にはさらに向上する余地がある.
ストラテジーソースコード
/*backtest
start: 2024-05-15 00:00:00
end: 2024-08-08 00:00:00
period: 1d
basePeriod: 1d
exchanges: [{"eid":"Binance","currency":"ETH_USDT"}]
*/

//@version=6
strategy(title="UT Bot Strategy", overlay=true, default_qty_type=strategy.percent_of_equity, default_qty_value=100)

// Inputs
a = input.float(1, title="Key Value. 'This changes the sensitivity'")
c = input.int(10, title="ATR Period")
h = input.bool(false, title="Signals from Heikin Ashi Candles")

// Calculate ATR
xATR = ta.atr(c)
nLoss = a * xATR

// Source for calculations
src = h ? request.security(syminfo.tickerid, timeframe.period, hlc3) : close

// ATR Trailing Stop logic
var float xATRTrailingStop = na
if (not na(xATRTrailingStop[1]) and src > xATRTrailingStop[1] and src[1] > xATRTrailingStop[1])
    xATRTrailingStop := math.max(xATRTrailingStop[1], src - nLoss)
else if (not na(xATRTrailingStop[1]) and src < xATRTrailingStop[1] and src[1] < xATRTrailingStop[1])
    xATRTrailingStop := math.min(xATRTrailingStop[1], src + nLoss)
else
    xATRTrailingStop := src > xATRTrailingStop[1] ? src - nLoss : src + nLoss

// Position logic
var int pos = 0
if (not na(xATRTrailingStop[1]) and src[1] < xATRTrailingStop[1] and src > xATRTrailingStop[1])
    pos := 1
else if (not na(xATRTrailingStop[1]) and src[1] > xATRTrailingStop[1] and src < xATRTrailingStop[1])
    pos := -1
else
    pos := pos[1]

xcolor = pos == -1 ? color.red : pos == 1 ? color.green : color.blue

// Entry and Exit Signals
ema = ta.ema(src, 1)
above = ta.crossover(ema, xATRTrailingStop)
below = ta.crossover(xATRTrailingStop, ema)

buy = src > xATRTrailingStop and above
sell = src < xATRTrailingStop and below

// Strategy Execution
if (buy)
    strategy.entry("UT Long", strategy.long)
if (sell)
    strategy.entry("UT Short", strategy.short)

// Plotting and Alerts
plotshape(buy, title="Buy", text='Buy', style=shape.labelup, location=location.belowbar, color=color.green, textcolor=color.white, size=size.tiny)
plotshape(sell, title="Sell", text='Sell', style=shape.labeldown, location=location.abovebar, color=color.red, textcolor=color.white, size=size.tiny)

barcolor(src > xATRTrailingStop ? color.green : src < xATRTrailingStop ? color.red : na)

alertcondition(buy, title="UT Long", message="UT Long")
alertcondition(sell, title="UT Short", message="UT Short")