
概要
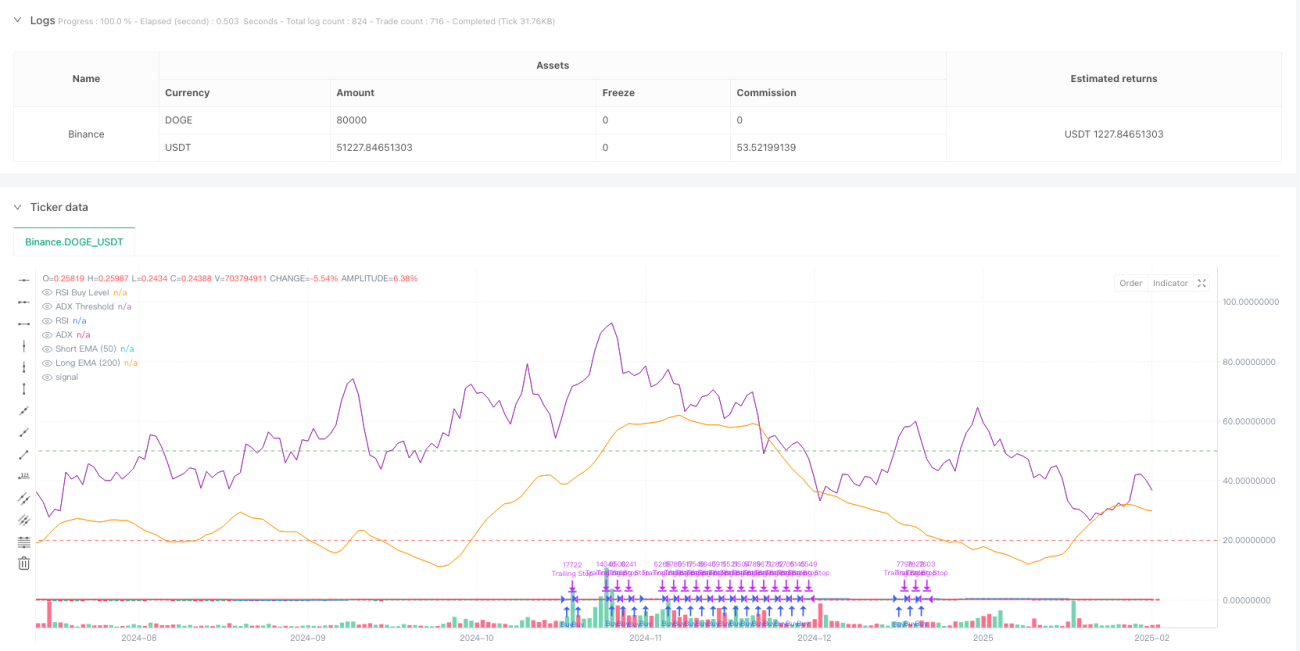
この戦略は,複数の移動平均,動向指標,およびダイナミック・リスク・コントロールを組み合わせたトレンド・トラッキング・システムである.戦略は,価格の傾向,市場の動き,および波動率を分析することによって取引機会を識別し,厳格なポジション管理とストップダウンの仕組みを適用しながらリスクを制御する.その核心ロジックは,長期短期指数移動平均の交差と相対的に強い弱指数 (RSI) の組み合わせを使用し,平均リアル波幅 (ATR) を介してストップダウンの位置を動的に調整する.
戦略原則
戦略は,取引シグナルを確認するために,多層の検証メカニズムを使用します.
- トレンド確認:50日と200日の2つの指数移動平均を使用して中長期のトレンドを判断し,短期平均線が長期平均線の上に10周期以上持続することを要求する.
- 動力の検証:RSI指標を使用して価格動力を検証し,RSI値が設定された<unk>値 (デフォルト50) よりも大きいとき,上昇の動きを確認する.
- トレンド強度:平均トレンド指数 ((ADX) を導入し,トレンド強さを測定する.ADXが20以上でトレンドが顕著であることを示す.
- 動的リスク制御:ATRをベースに設計された動的止損,止損距離はATRの2.5倍で,同時に追跡止損機構を設定する.
- スマートポジション管理:口座の利権と預設リスクの比率に基づいて,ATRの動態と組み合わせた開設ポジションの数を計算する.
戦略的優位性
- 複数の信号の検証:平均線,動力,傾向強度などの複数の次元の指標の検証により,信号の信頼性を向上させる.
- ダイナミックなリスク管理:変動率に基づくダイナミックなストップとトラッキングストップを採用し,市場の状況に応じて自律的に調整することができる.
- スマートポジションコントロール:口座規模と市場の変動率に基づいてポジションを動的に調整し,単一取引のリスクを効果的に制御する.
- トレンド継続性要求: トレンド持続時間要求を設定することで,偽突破を回避する.
- システム化された取引提示:取引シグナルの提醒機能を統合し,リアルタイムで操作する.
戦略リスク
- トレンド反転リスク: 強いトレンドの終わりに大きな引き下がりが起こりうるため,市場マクロ面と連携して調整することが推奨される.
- 振動市場:横盤振動市場では,取引が頻繁になり,取引コストが増加する可能性があります.
- パラメータの感受性:複数の指標パラメータの設定は,戦略のパフォーマンスに影響を与え,フィードバックで最適化する必要があります.
- スライドポイントの影響: 市場流動性が不足しているときに,戦略的利益に影響を与える大きなスライドポイントに直面する可能性があります.
戦略最適化の方向性
- 市場環境の適応:変動率指標 ((VIXのような) を導入して,戦略パラメータを動的に調整し,異なる市場環境の適応性を向上させる.
- 信号フィルタリング: 取引量指標の検証を追加し,信号の質を向上させる.
- ストップメカニズム:市場変動に基づくダイナミックストップメカニズムを設計し,収益回収率を最適化することができる.
- タイムサイクル最適化:異なるタイムサイクルでシグナル一致性を検証することを考慮し,取引の安定性を向上させる.
- 機械学習最適化: 戦略の適応性を高めるために,機械学習アルゴリズムの動的最適化パラメータを導入することができる.
要約する
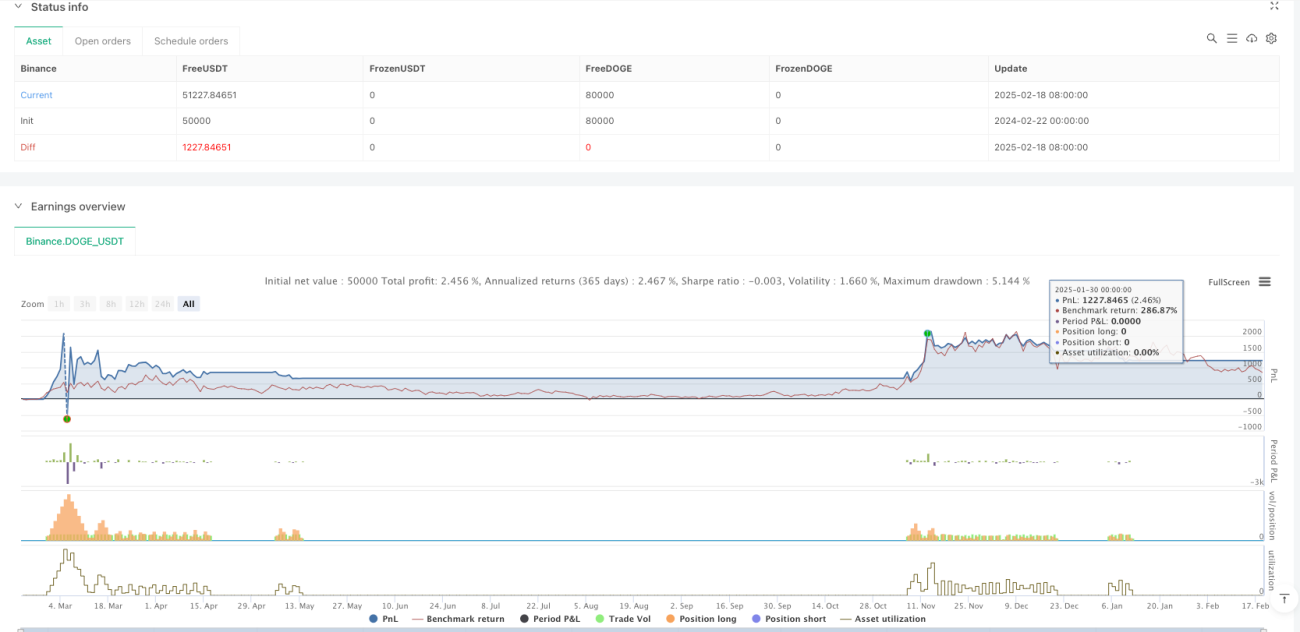
この戦略は,複数の技術指標の総合的な使用によって,完全なトレンド追跡取引システムを構築している.戦略は,リスク管理において優れたパフォーマンスを発揮し,ダイナミックなストップ損失とポジション管理により,撤収を効果的に制御している.戦略は,拡張性が強く,複数の最適化方向を保留している.トレーダーは,実際の使用時に,特定の市場の特徴と自身のリスクの好みに応じてパラメータを調整することを推奨している.
Overview
This strategy is a trend following system that combines multiple moving averages, momentum indicators, and dynamic risk control. It identifies trading opportunities by analyzing price trends, market momentum, and volatility while implementing strict position management and stop-loss mechanisms. The core logic revolves around the crossover of long and short-term exponential moving averages (EMA) combined with the Relative Strength Index (RSI), using Average True Range (ATR) for dynamic stop-loss positioning.
Strategy Principles
The strategy employs a multi-layer verification mechanism to confirm trading signals:
- Trend Confirmation: Uses 50-day and 200-day EMAs to judge medium and long-term trends, requiring the short-term average to remain above the long-term average for more than 10 periods.
- Momentum Verification: Uses RSI to verify price momentum, confirming upward momentum when RSI exceeds the set threshold (default 50).
- Trend Strength: Incorporates Average Directional Index (ADX) to measure trend strength, with ADX above 20 indicating significant trend.
- Dynamic Risk Control: Designs dynamic stop-loss based on ATR, with stop-loss distance set at 2.5 times ATR, including trailing stop mechanism.
- Intelligent Position Management: Dynamically calculates position size based on account equity and preset risk ratio in combination with ATR.
Strategy Advantages
- Multiple Signal Verification: Improves signal reliability through validation across multiple dimensions including moving averages, momentum, and trend strength.
- Dynamic Risk Management: Employs volatility-based dynamic and trailing stops that adapt to market conditions.
- Intelligent Position Control: Dynamically adjusts positions based on account size and market volatility, effectively controlling single trade risk.
- Trend Persistence Requirement: Avoids false breakouts by setting trend duration requirements.
- Systematic Trading Alerts: Integrates trading signal notifications for real-time operation.
Strategy Risks
- Trend Reversal Risk: May experience significant drawdowns at trend endings, suggesting adjustment based on macro market conditions.
- Sideways Market Performance: May generate frequent trades in range-bound markets, increasing transaction costs.
- Parameter Sensitivity: Strategy performance affected by multiple indicator parameters, requiring backtest optimization.
- Slippage Impact: May face significant slippage in low liquidity conditions, affecting strategy returns.
Optimization Directions
- Market Environment Adaptation: Consider introducing volatility indicators (like VIX) for dynamic parameter adjustment to improve adaptability across different market conditions.
- Signal Filtering: Consider adding volume indicator verification to improve signal quality.
- Profit-Taking Mechanism: Design dynamic profit-taking mechanisms based on market volatility to optimize return-to-drawdown ratio.
- Timeframe Optimization: Consider validating signal consistency across different timeframes to improve trading stability.
- Machine Learning Optimization: Consider introducing machine learning algorithms for dynamic parameter optimization to enhance strategy adaptability.
Summary
This strategy constructs a complete trend following trading system through the comprehensive use of multiple technical indicators. It shows excellent performance in risk control through dynamic stop-loss and position management. The strategy demonstrates strong extensibility with multiple optimization directions reserved. Traders are advised to adjust parameters according to specific market characteristics and their own risk preferences when implementing in live trading.
- 1